引言
在这篇指南中,我们介绍了Seurat的一个新扩展功能,用以分析新型的空间解析数据,将重点介绍由不同成像技术生成的三个公开数据集。
- Vizgen MERSCOPE(用于小鼠大脑研究)
- Nanostring CosMx空间分子成像仪(用于FFPE人类肺组织)
- Akoya CODEX(用于人类淋巴结研究)
小鼠大脑:10x Genomics Xenium In Situ
在本节中,我们将对Xenium平台生成的数据进行分析。本指南展示了如何导入Xenium平台输出的每转录本位置信息、细胞与基因的表达矩阵、细胞边界分割以及细胞中心点数据。得到的Seurat对象将包含每个细胞的基因表达概况、细胞的中心点和边界位置,以及每个被检测到的转录本的具体位置。这些细胞层面的基因表达概况与标准的单细胞RNA测序数据相似,可以运用相同的分析工具进行处理。
这里使用的是10x Genomics公司为Xenium Explorer Demo提供的“Tiny”子集数据集,该数据集源自“Fresh Frozen Mouse Brain”,下载方式如下。这些分析步骤同样适用于更大的“完整冠状切面”数据集,但处理时间会更长。
wget https://cf.10xgenomics.com/samples/xenium/1.0.2/Xenium_V1_FF_Mouse_Brain_Coronal_Subset_CTX_HP/Xenium_V1_FF_Mouse_Brain_Coronal_Subset_CTX_HP_outs.zip
unzip Xenium_V1_FF_Mouse_Brain_Coronal_Subset_CTX_HP_outs.zip
首先,我们读取数据集并创建一个 Seurat 对象。提供 Xenium 运行的数据文件夹的路径作为输入路径。 RNA 数据存储在 Seurat 对象的 Xenium 分析中。此步骤大约需要一分钟。
path <- "/brahms/hartmana/vignette_data/xenium_tiny_subset"
# Load the Xenium data
xenium.obj <- LoadXenium(path, fov = "fov")
# remove cells with 0 counts
xenium.obj <- subset(xenium.obj, subset = nCount_Xenium > 0)
空间数据被嵌入到Seurat对象的特定字段中,这些字段以加载的“视野”(Field of View,简称FOV)名称来标识。一开始,所有的数据都被加载到默认的FOV中,名为fov。接下来,我们将创建一个新的视野,这个视野将聚焦于我们特别关注的区域。
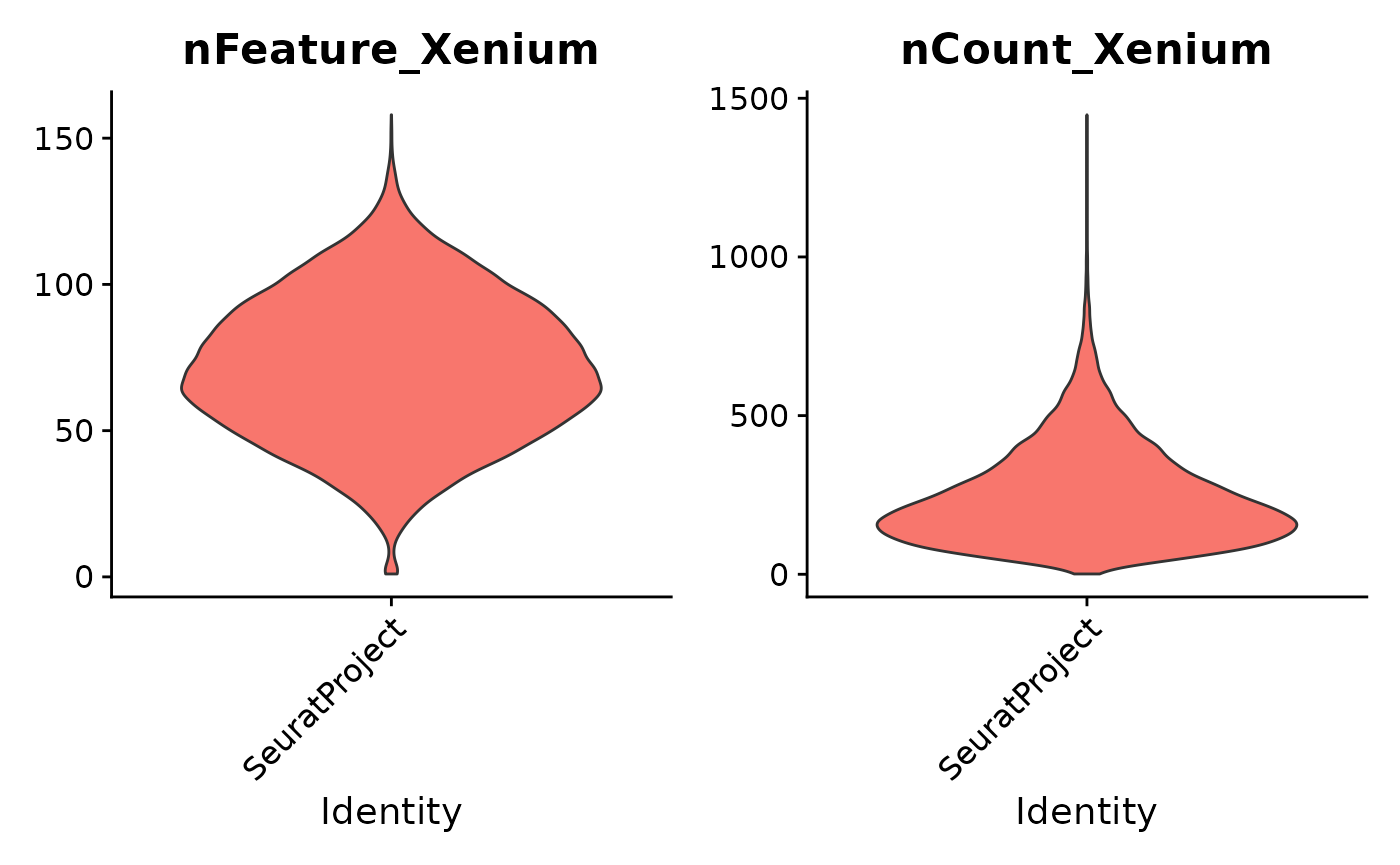
Xenium分析工具提供了Seurat的标准质量控制图表。例如,我们可以通过小提琴图来查看每个细胞中的基因数量(nFeature_Xenium)和每个细胞中的转录本计数(nCount_Xenium)。这些图表帮助我们对数据集的质量有一个直观的了解。
VlnPlot(xenium.obj, features = c("nFeature_Xenium", "nCount_Xenium"), ncol = 2, pt.size = 0)
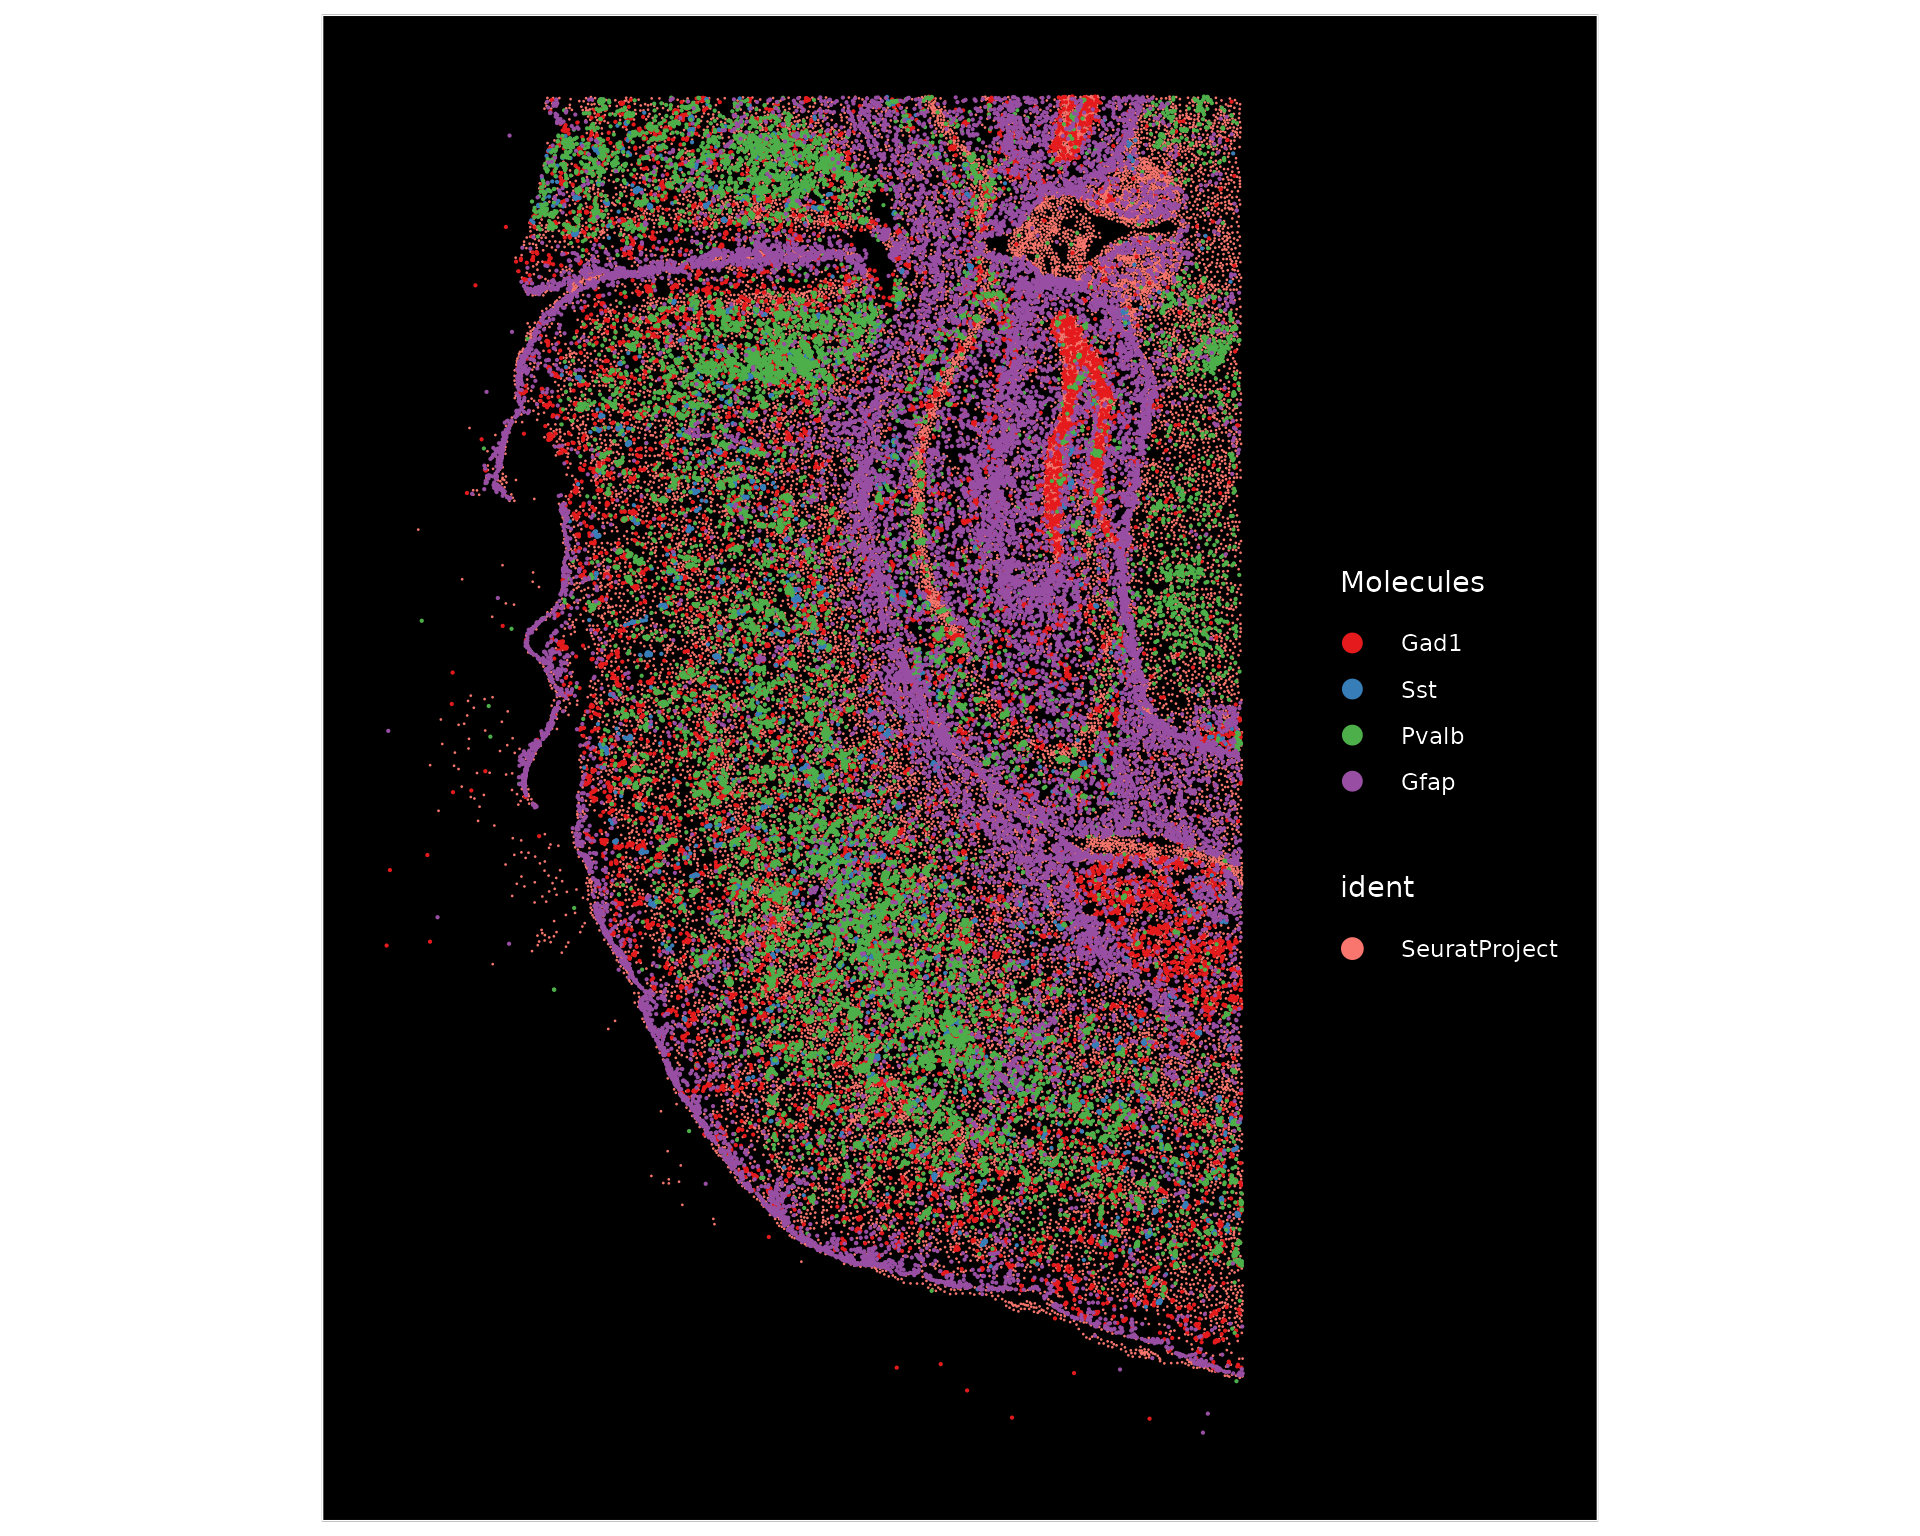
接下来,我们使用 ImageDimPlot() 在组织上绘制全抑制神经元标记 Gad1、抑制神经元亚型标记 Pvalb 和 Sst 以及星形胶质细胞标记 Gfap 的位置。
ImageDimPlot(xenium.obj, fov = "fov", molecules = c("Gad1", "Sst", "Pvalb", "Gfap"), nmols = 20000)
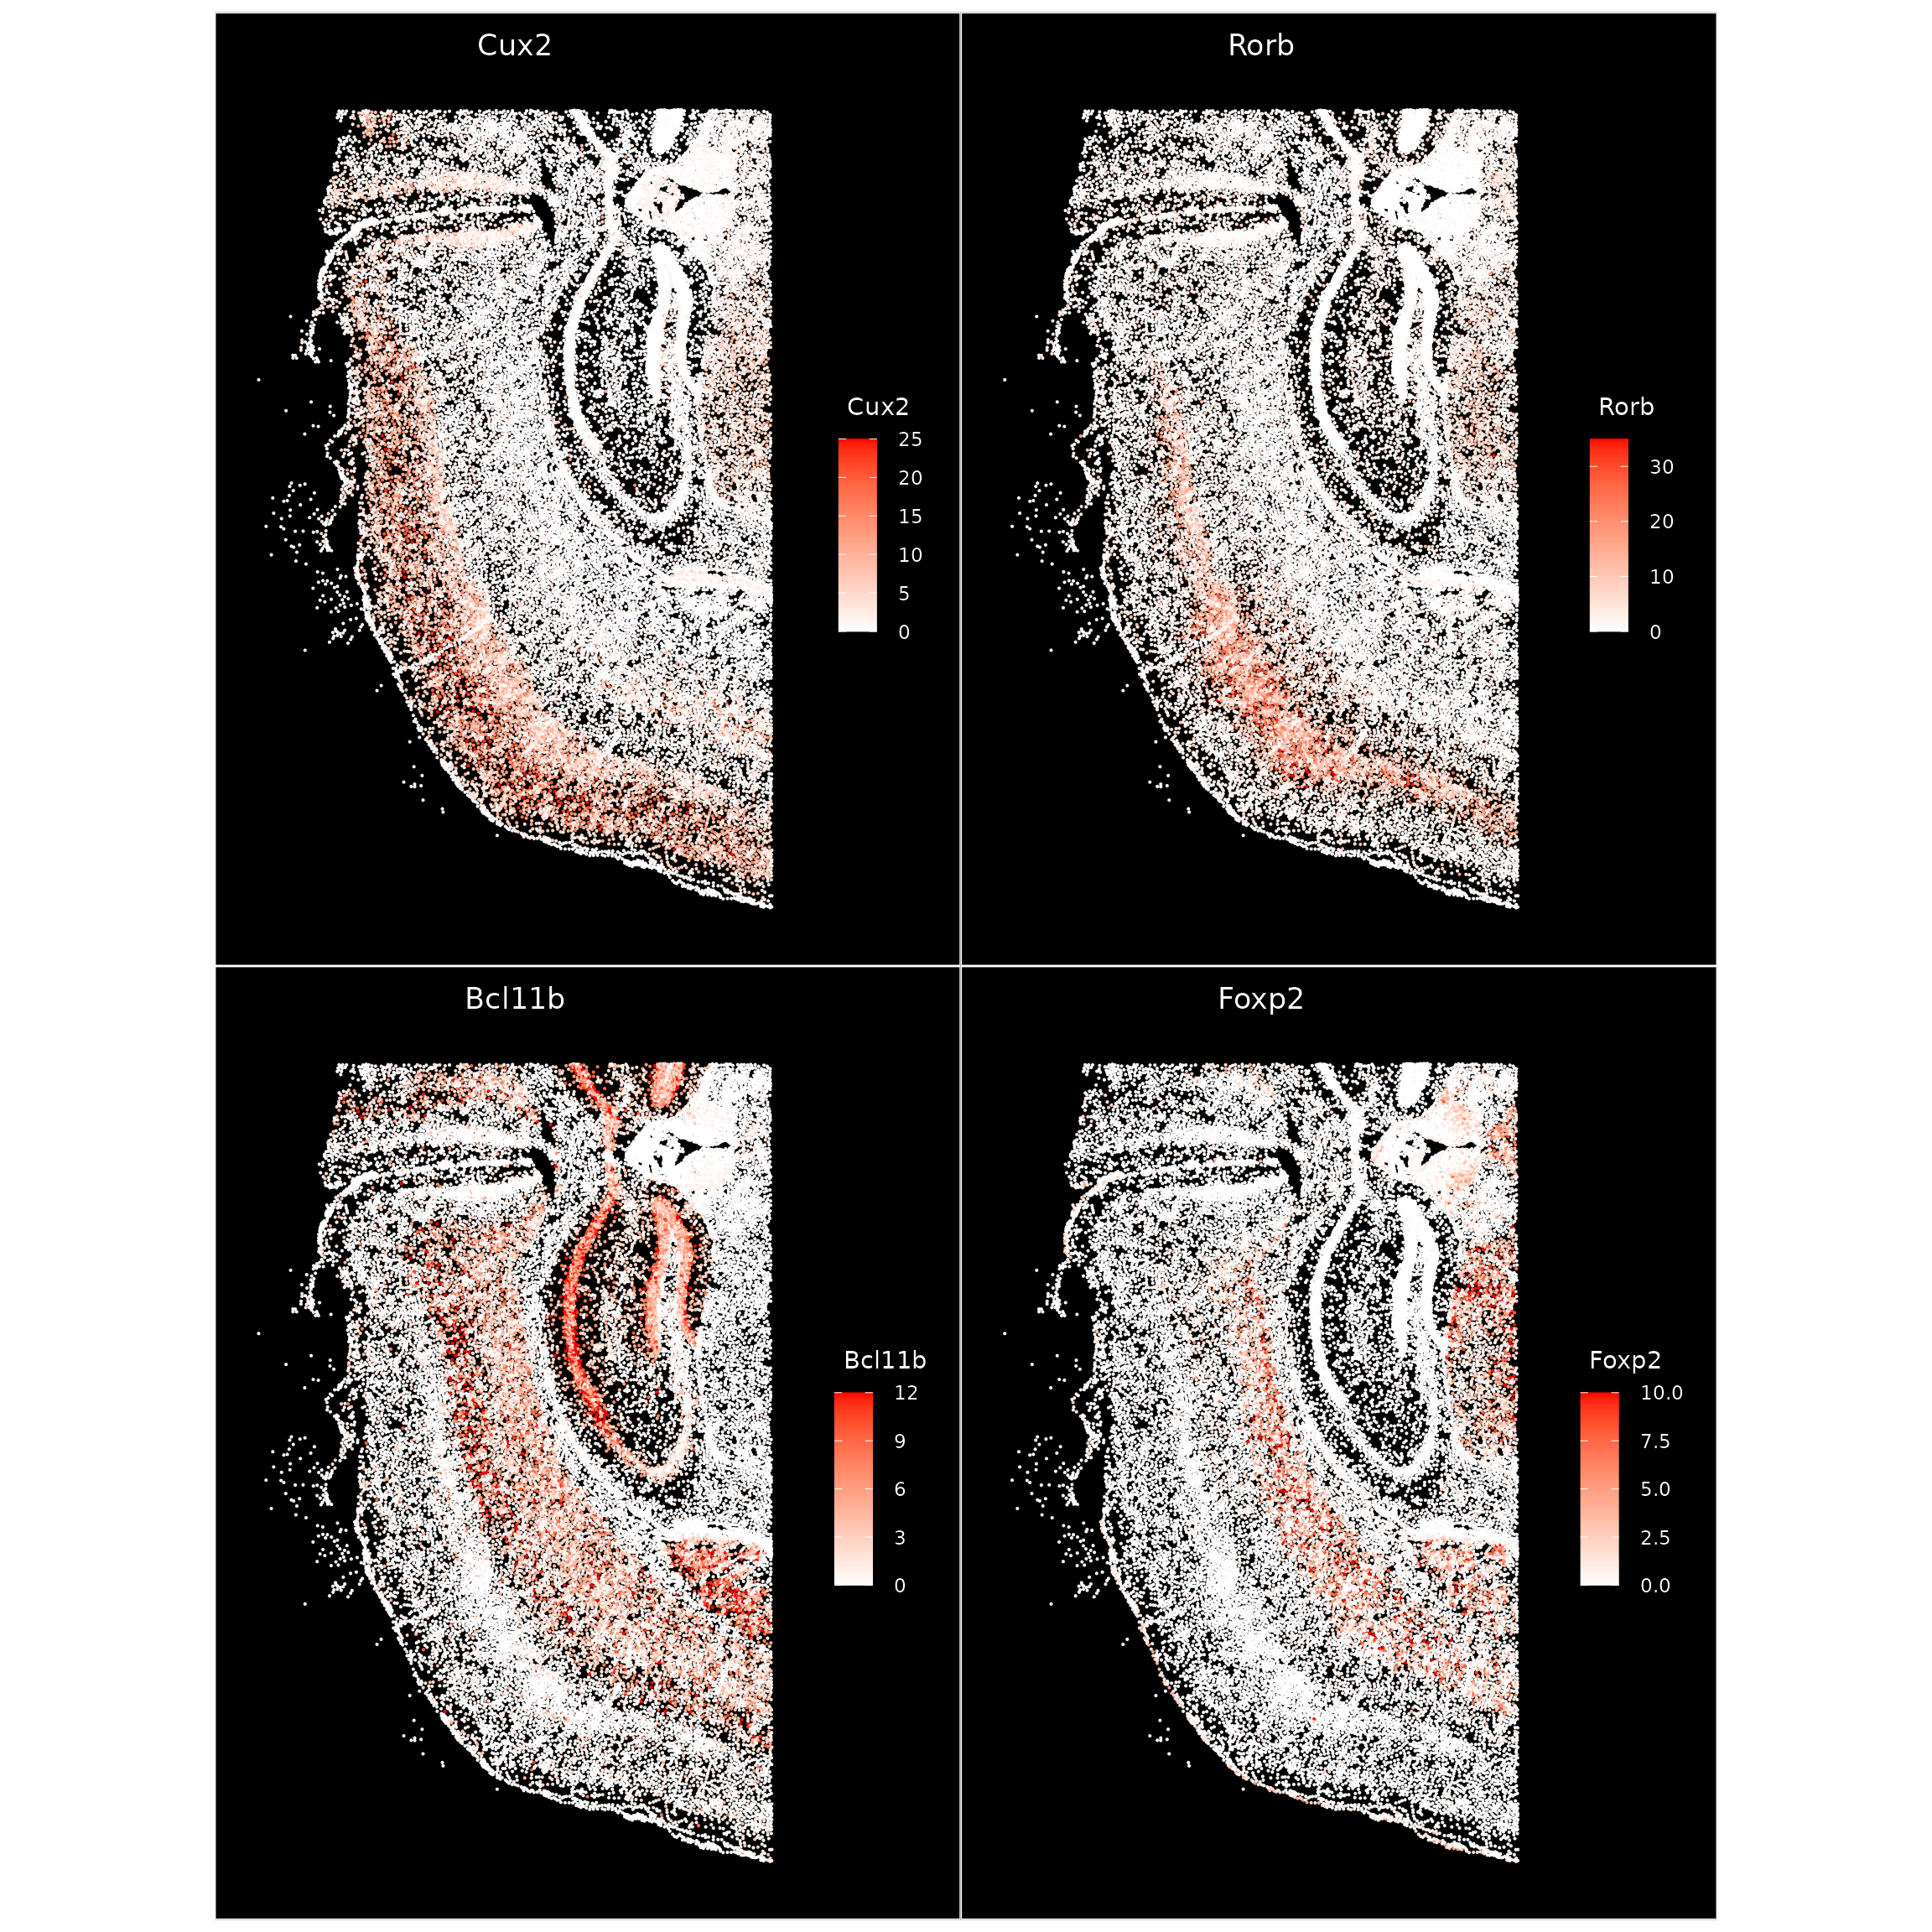
在这里,我们使用 ImageFeaturePlot() 在每个细胞水平上可视化一些关键层标记基因的表达水平,这类似于用于可视化 2D 嵌入表达的 FeaturePlot() 函数。我们手动将每个基因的 max.cutoff 调整到其计数分布的大约第 90 个百分位数(可以使用 max.cutoff='q90' 指定)以提高对比度。
ImageFeaturePlot(xenium.obj, features = c("Cux2", "Rorb", "Bcl11b", "Foxp2"), max.cutoff = c(25,
    35, 12, 10), size = 0.75, cols = c("white", "red"))
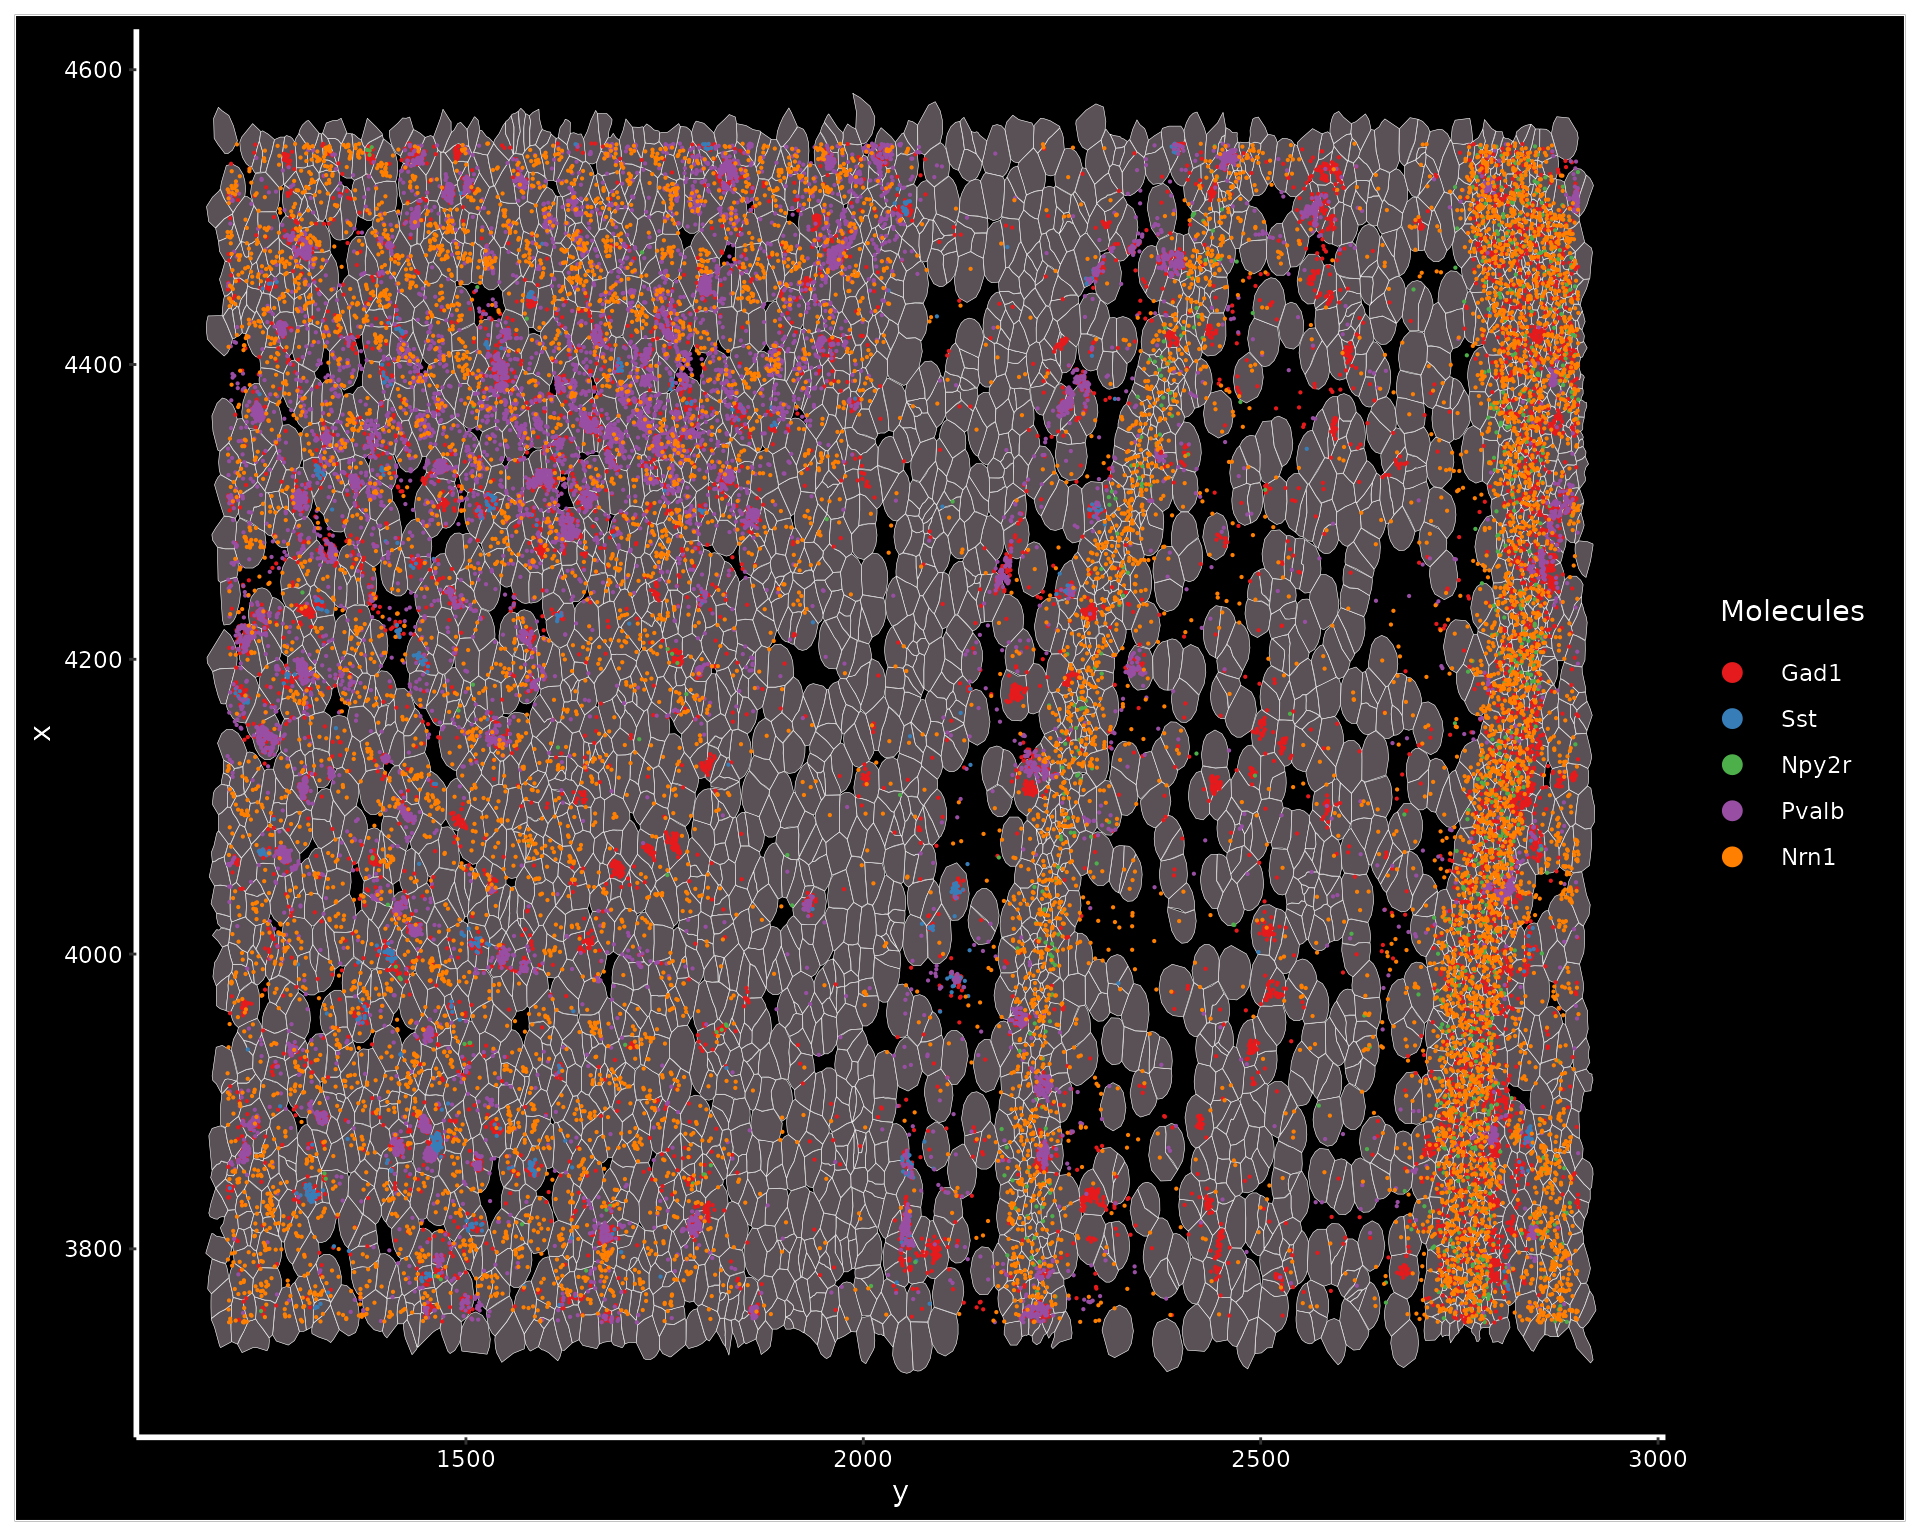
我们可以使用 Crop() 函数放大所选区域。放大后,我们可以可视化细胞分割边界以及单个分子。
cropped.coords <- Crop(xenium.obj[["fov"]], x = c(1200, 2900), y = c(3750, 4550), coords = "plot")
xenium.obj[["zoom"]] <- cropped.coords
# visualize cropped area with cell segmentations & selected molecules
DefaultBoundary(xenium.obj[["zoom"]]) <- "segmentation"
ImageDimPlot(xenium.obj, fov = "zoom", axes = TRUE, border.color = "white", border.size = 0.1, cols = "polychrome",
    coord.fixed = FALSE, molecules = c("Gad1", "Sst", "Npy2r", "Pvalb", "Nrn1"), nmols = 10000)
接下来,我们使用 SCTransform 进行归一化,然后进行标准降维和聚类。此步骤从开始到结束大约需要 5 分钟。
xenium.obj <- SCTransform(xenium.obj, assay = "Xenium")
xenium.obj <- RunPCA(xenium.obj, npcs = 30, features = rownames(xenium.obj))
xenium.obj <- RunUMAP(xenium.obj, dims = 1:30)
xenium.obj <- FindNeighbors(xenium.obj, reduction = "pca", dims = 1:30)
xenium.obj <- FindClusters(xenium.obj, resolution = 0.3)
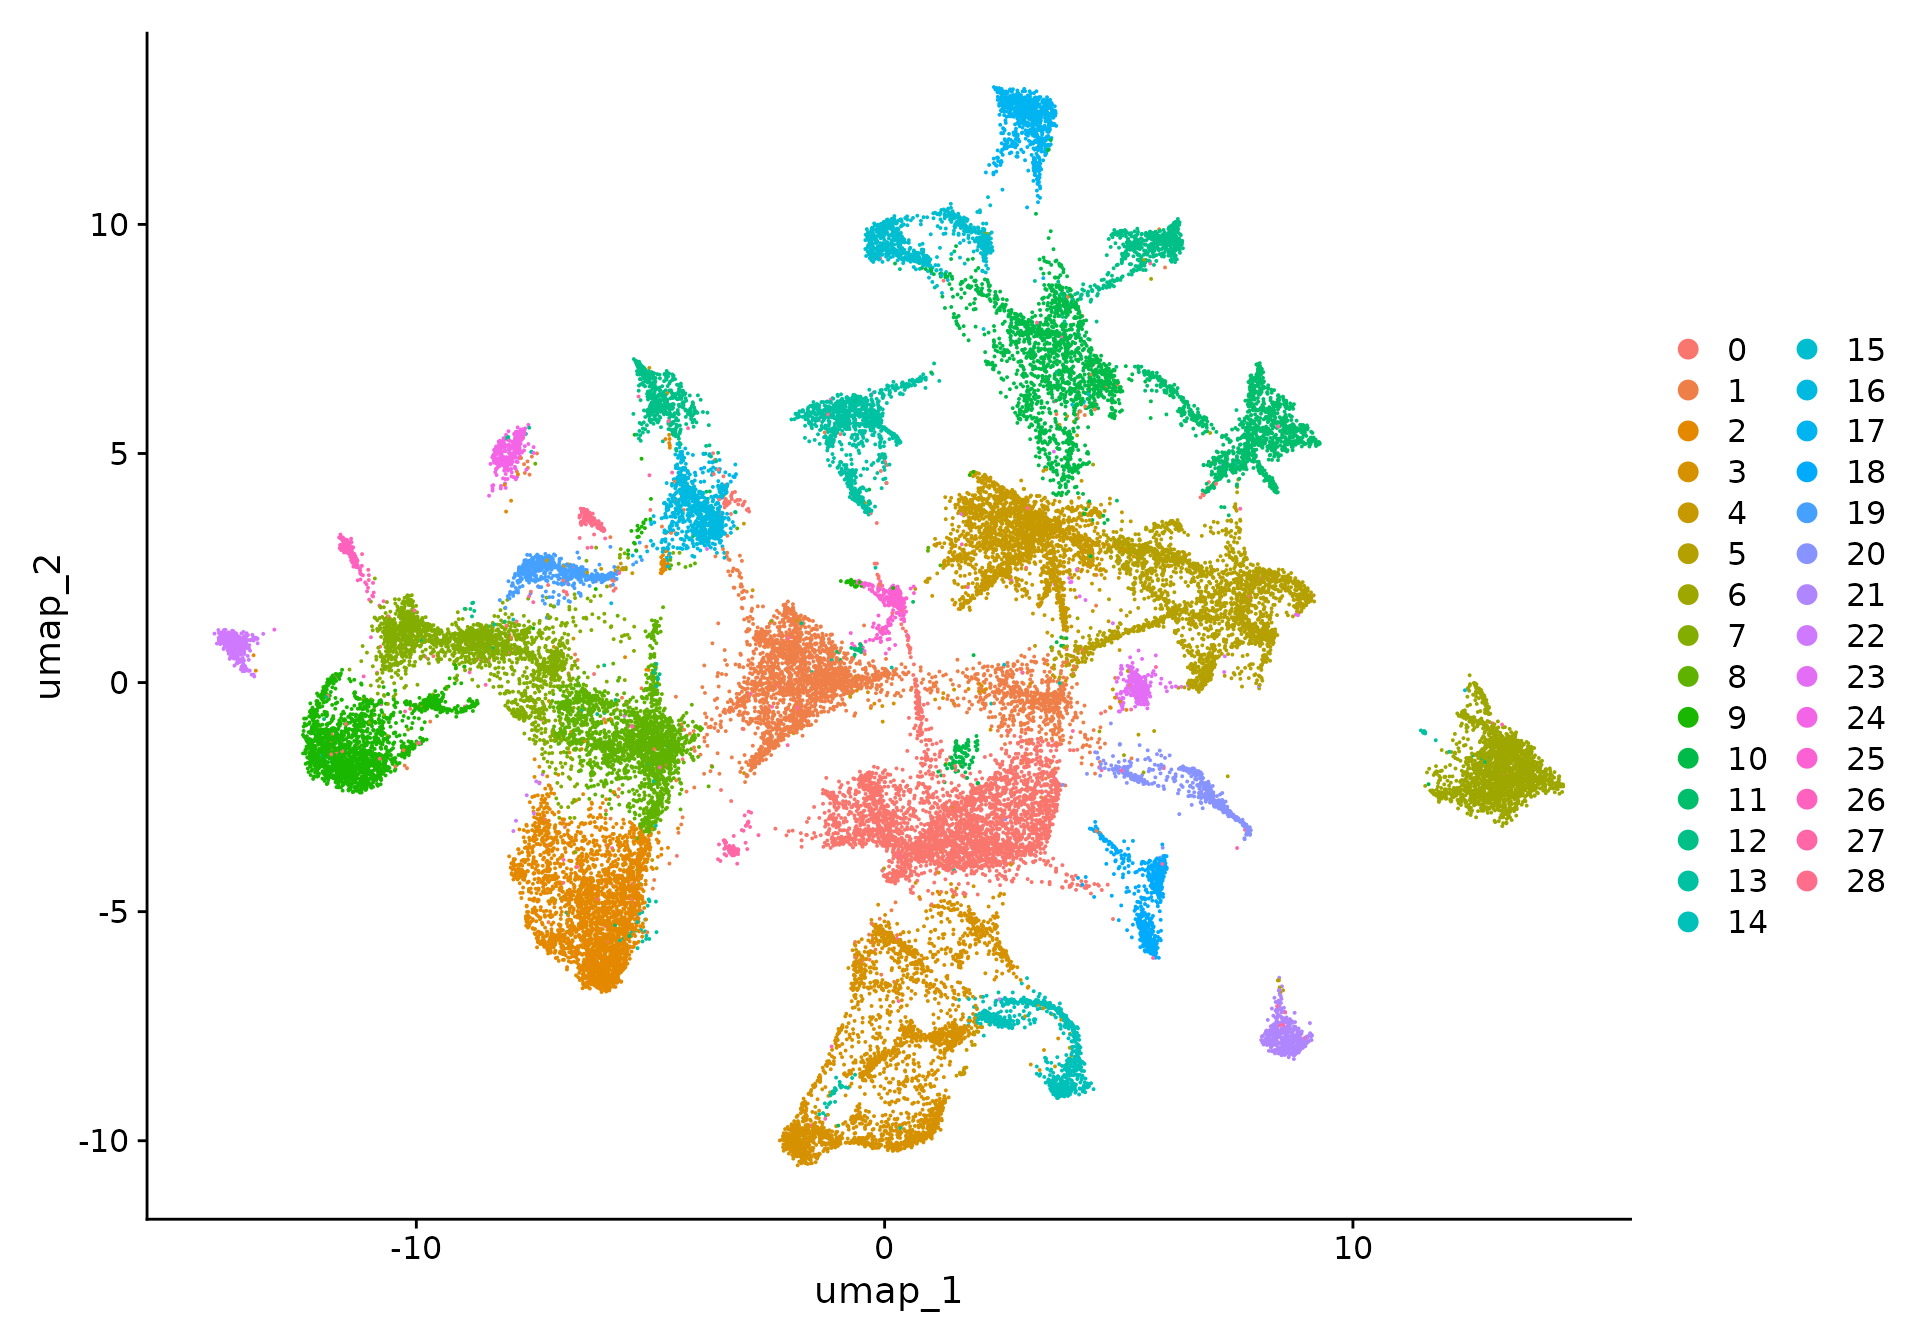
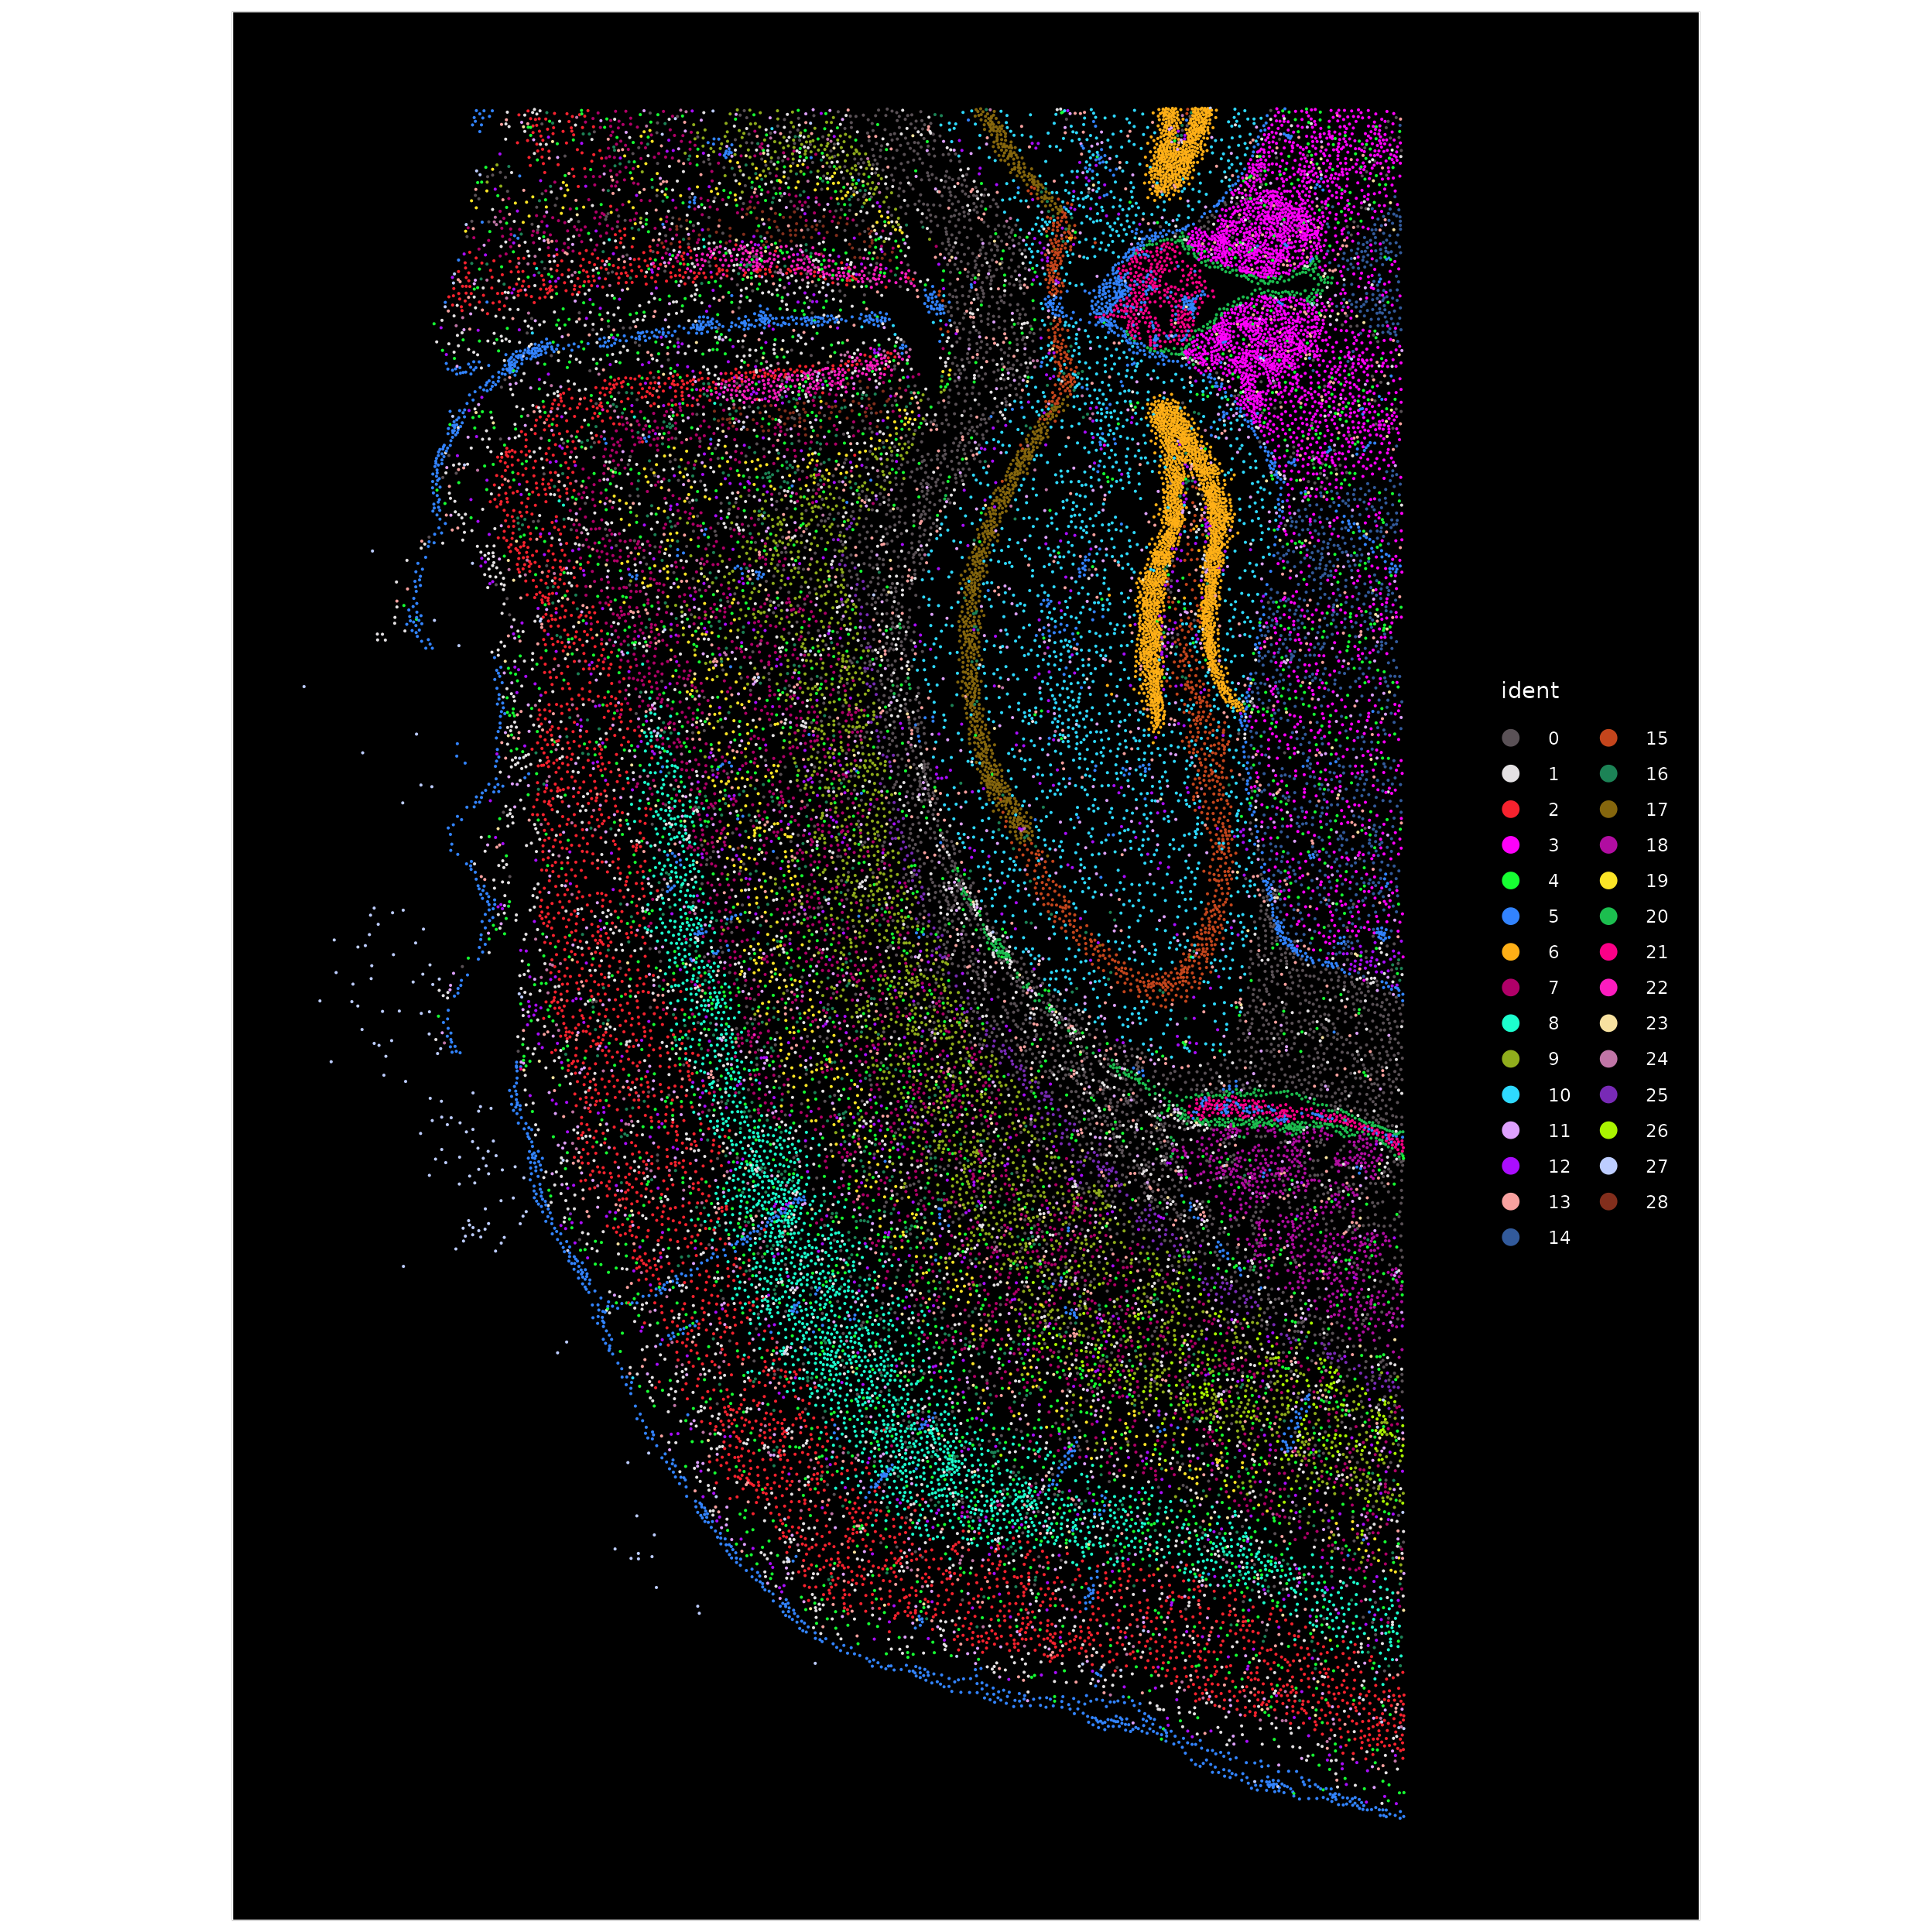
然后,我们可以使用 DimPlot() 在 UMAP 空间中根据每个细胞的聚类对每个单元格进行着色,或者使用 ImageDimPlot() 覆盖在图像上,从而可视化聚类结果。
DimPlot(xenium.obj)
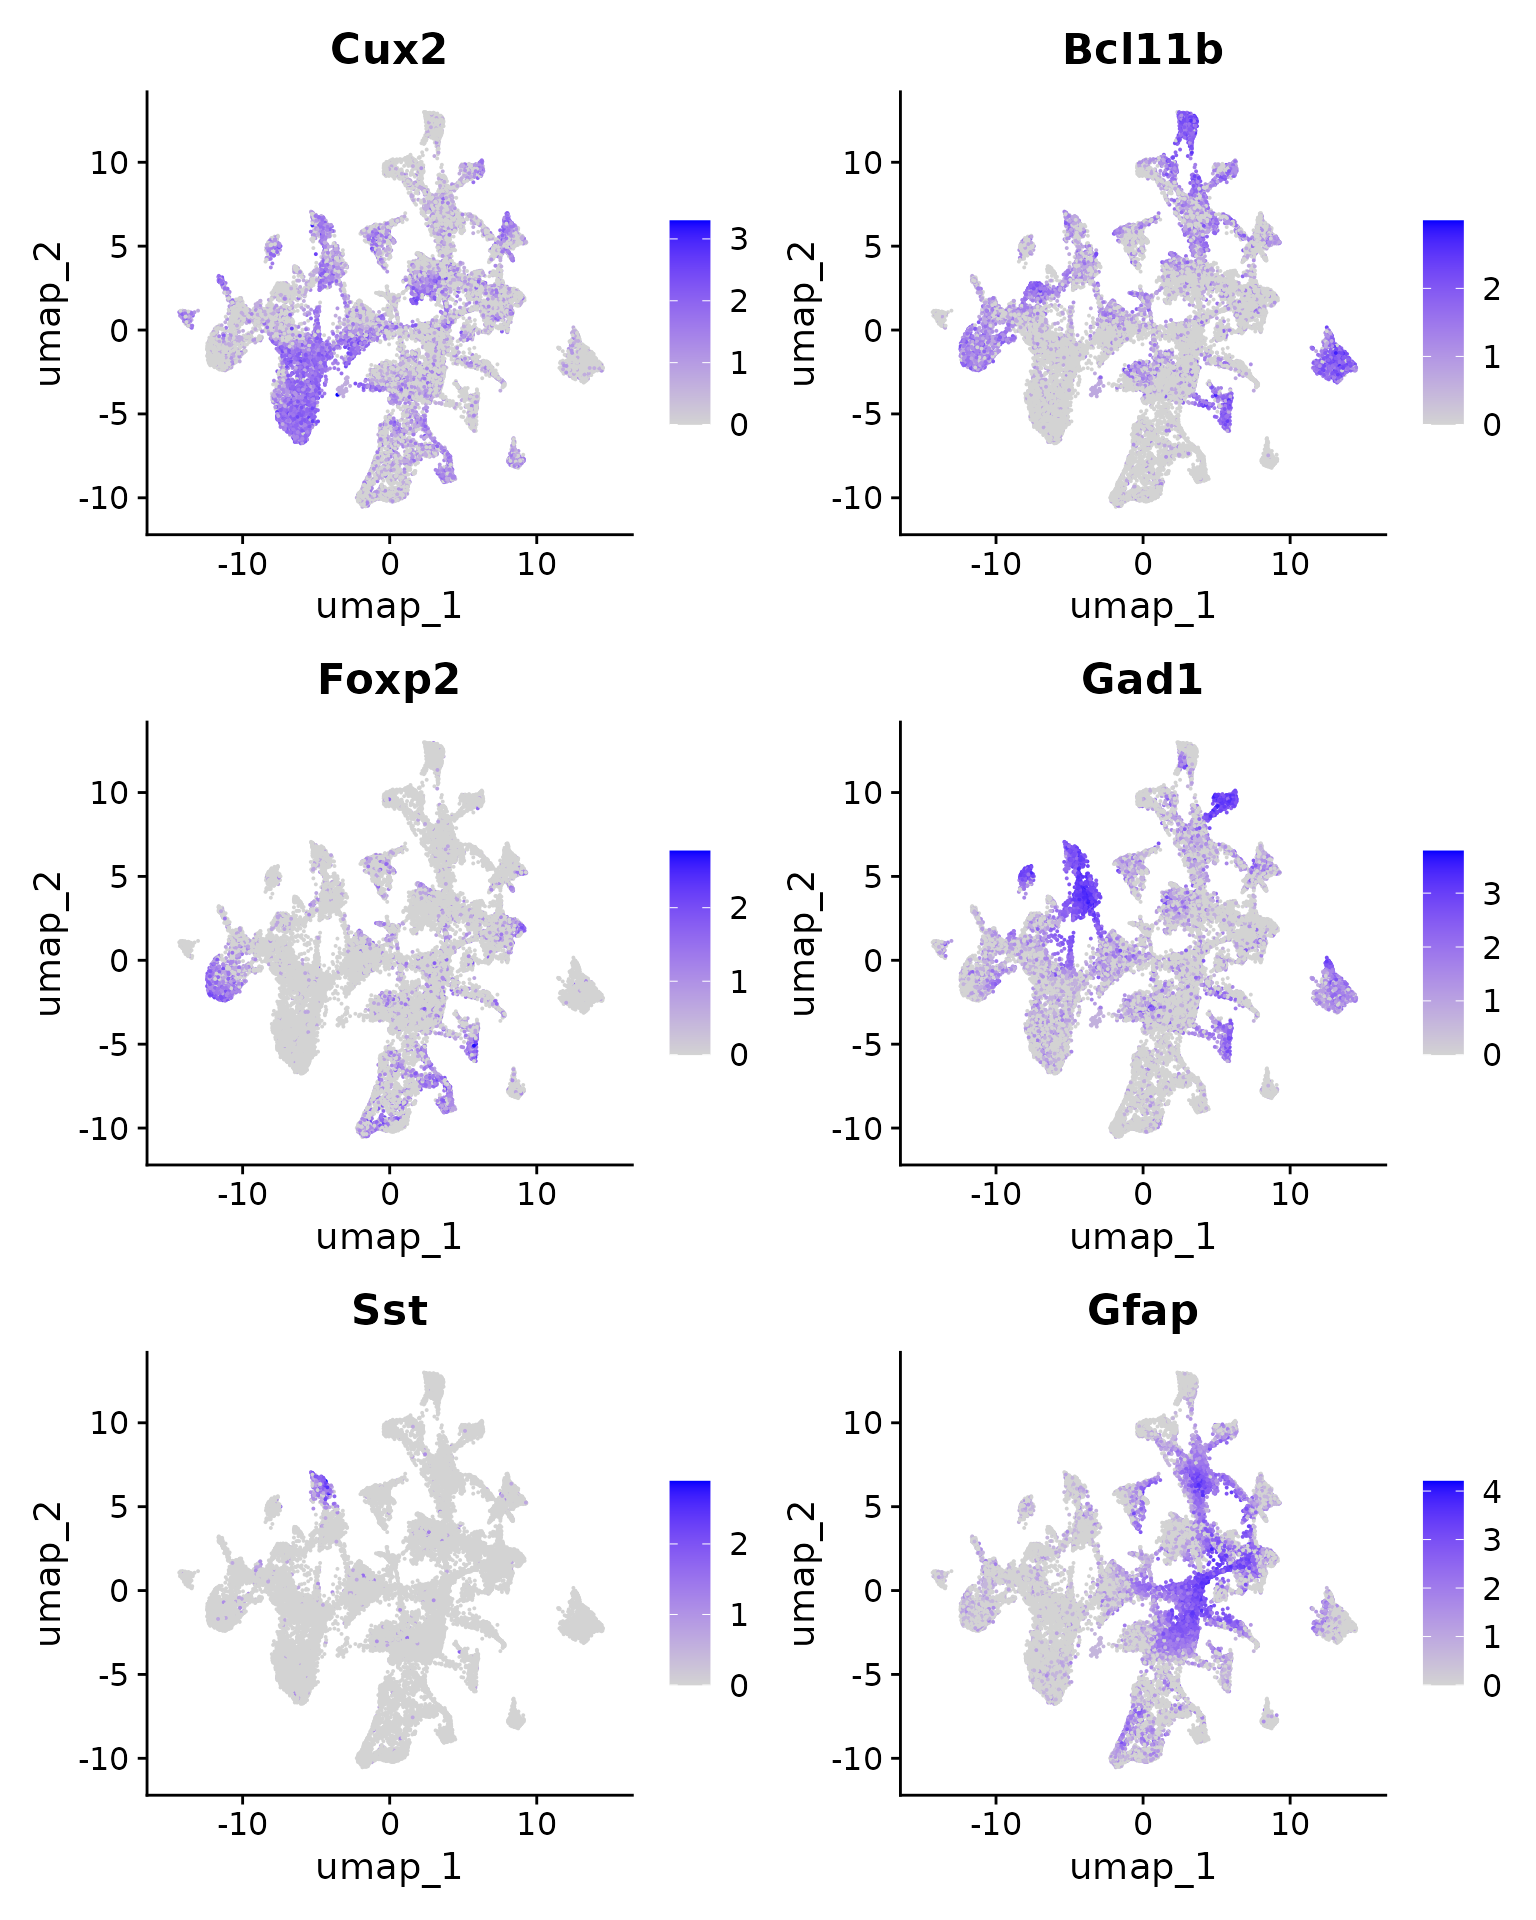
我们可以在 UMAP 坐标上可视化之前查看的标记的表达水平。
FeaturePlot(xenium.obj, features = c("Cux2", "Bcl11b", "Foxp2", "Gad1", "Sst", "Gfap"))
现在,我们可以使用 ImageDimPlot() 为上一步中确定的簇标签着色的细胞位置着色。
ImageDimPlot(xenium.obj, cols = "polychrome", size = 0.75)
利用每个细胞的定位信息,我们能够计算出它们各自的空间生态位。为了对细胞进行注释,我们采用了Allen Brain Institute提供的大脑皮层参考数据,因此首先需要将整个数据集的范围限定在大脑皮层。可以通过提供的链接安装Allen Brain的参考数据。
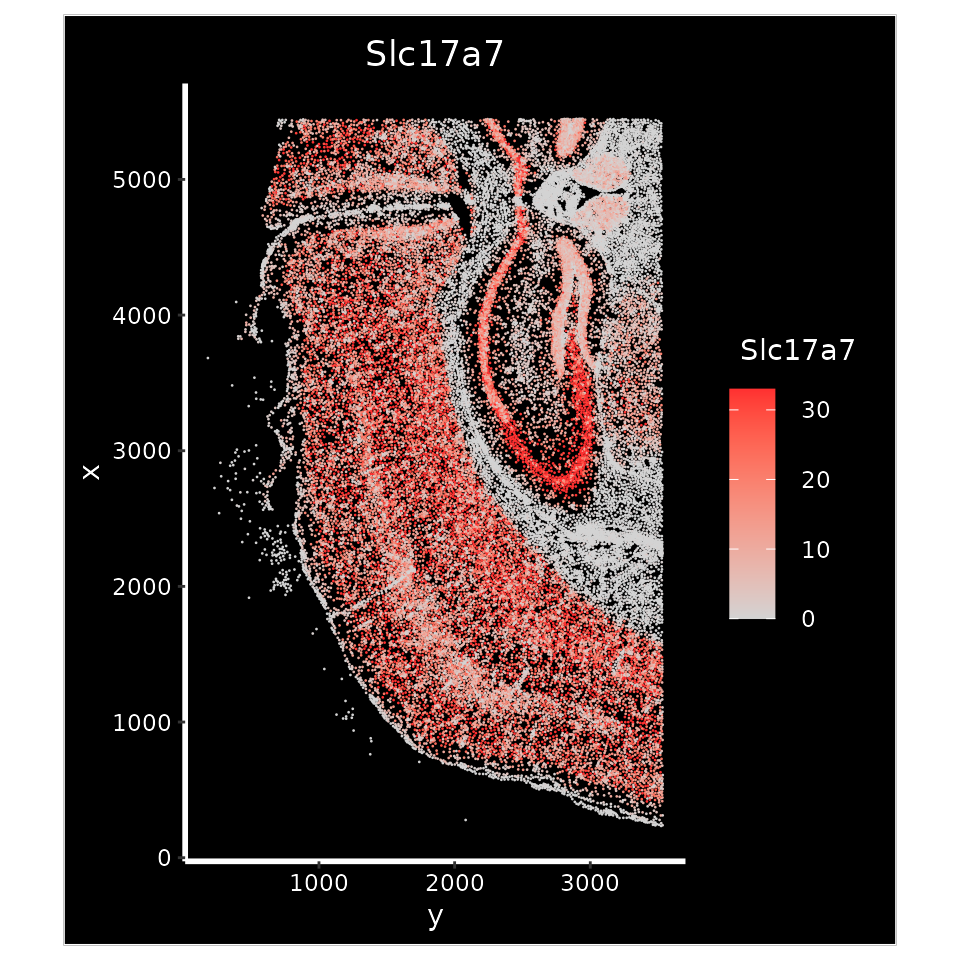
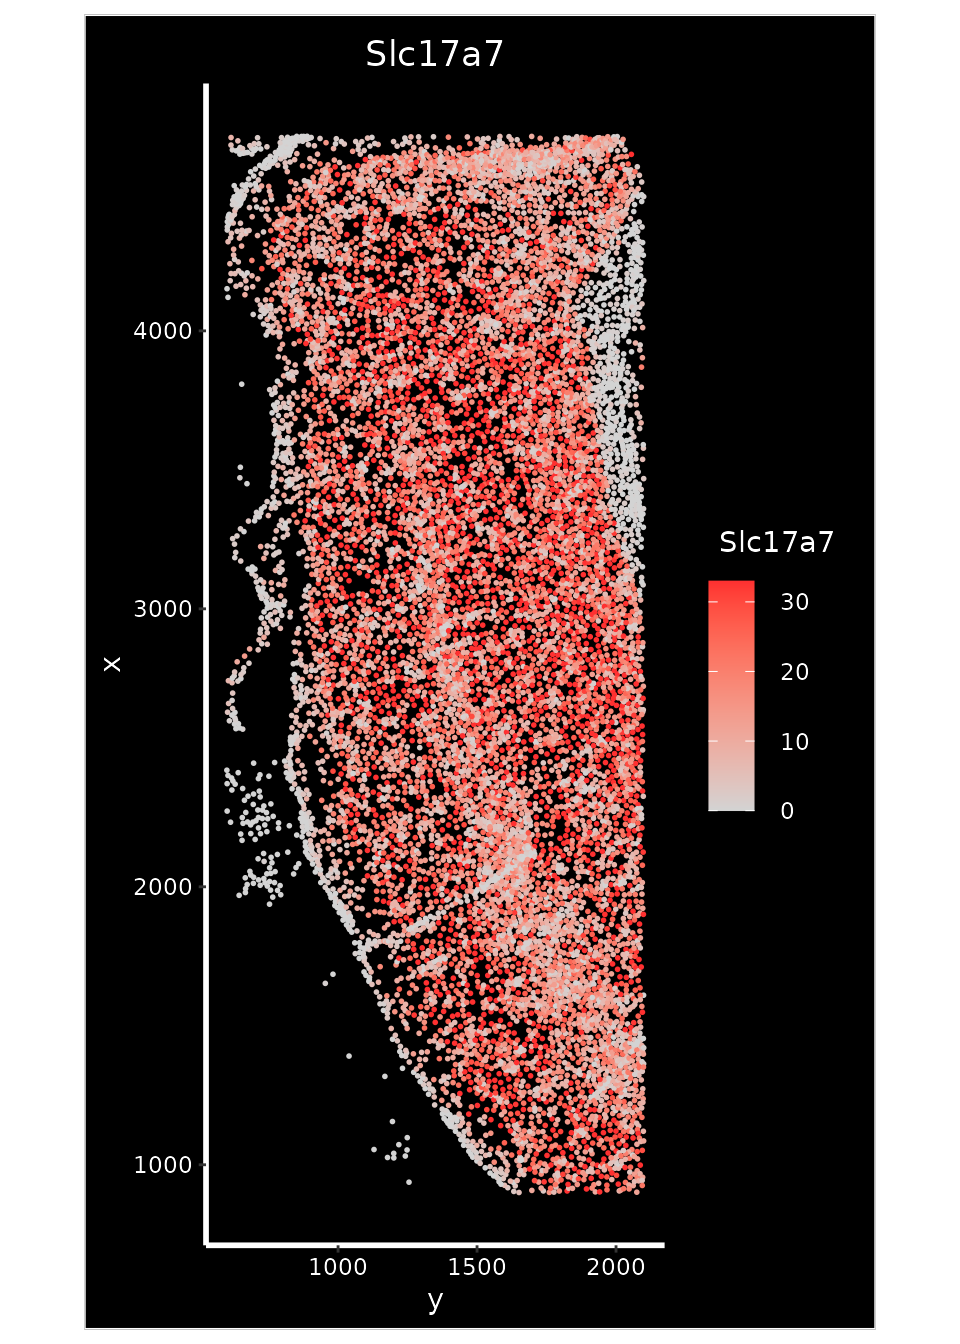
在下面的分析中,我们利用Slc17a7基因的表达情况来辅助识别大脑皮层的具体区域。
xenium.obj <- LoadXenium("/brahms/hartmana/vignette_data/xenium_tiny_subset")
p1 <- ImageFeaturePlot(xenium.obj, features = "Slc17a7", axes = TRUE, max.cutoff = "q90")
p1
crop <- Crop(xenium.obj[["fov"]], x = c(600, 2100), y = c(900, 4700))
xenium.obj[["crop"]] <- crop
p2 <- ImageFeaturePlot(xenium.obj, fov = "crop", features = "Slc17a7", size = 1, axes = TRUE, max.cutoff = "q90")
p2
FindTransferAnchors函数能够用来整合空间转录组数据集中的单个斑点数据。而Seurat v5版本进一步支持了一种名为Robust Cell Type Decomposition(稳健细胞类型分解,简称RCTD)的计算方法,该方法能够在提供单细胞RNA测序(scRNA-seq)参考数据的基础上,对空间数据集中的斑点数据进行解卷积分析。RCTD已被证实能够有效地对来自SLIDE-seq、Visium以及10x Genomics公司的Xenium原位空间平台等多种技术的空间数据进行注释。
为了执行RCTD分析,我们首先需要从GitHub上安装名为spacexr的R包,该包提供了RCTD功能的实现。
devtools::install_github("dmcable/spacexr", build_vignettes = FALSE)
从 Seurat 查询和参考对象中提取计数、聚类和点信息,以构建 RCTD 用于注释的参考和 SpatialRNA 对象。然后将注释的输出添加到 Seurat 对象。
library(spacexr)

query.counts <- GetAssayData(xenium.obj, assay = "Xenium", slot = "counts")[, Cells(xenium.obj[["crop"]])]
coords <- GetTissueCoordinates(xenium.obj[["crop"]], which = "centroids")
rownames(coords) <- coords$cell
coords$cell <- NULL
query <- SpatialRNA(coords, query.counts, colSums(query.counts))

# allen.corted.ref can be downloaded here:
# https://www.dropbox.com/s/cuowvm4vrf65pvq/allen_cortex.rds?dl=1
allen.cortex.ref <- readRDS("/brahms/shared/vignette-data/allen_cortex.rds")
allen.cortex.ref <- UpdateSeuratObject(allen.cortex.ref)

Idents(allen.cortex.ref) <- "subclass"
# remove CR cells because there aren't enough of them for annotation
allen.cortex.ref <- subset(allen.cortex.ref, subset = subclass != "CR")
counts <- GetAssayData(allen.cortex.ref, assay = "RNA", slot = "counts")
cluster <- as.factor(allen.cortex.ref$subclass)
names(cluster) <- colnames(allen.cortex.ref)
nUMI <- allen.cortex.ref$nCount_RNA
names(nUMI) <- colnames(allen.cortex.ref)
nUMI <- colSums(counts)
levels(cluster) <- gsub("/", "-", levels(cluster))
reference <- Reference(counts, cluster, nUMI)

# run RCTD with many cores
RCTD <- create.RCTD(query, reference, max_cores = 8)
RCTD <- run.RCTD(RCTD, doublet_mode = "doublet")

annotations.df <- RCTD@results$results_df
annotations <- annotations.df$first_type
names(annotations) <- rownames(annotations.df)
xenium.obj$predicted.celltype <- annotations
keep.cells <- Cells(xenium.obj)[!is.na(xenium.obj$predicted.celltype)]
xenium.obj <- subset(xenium.obj, cells = keep.cells)
与以往的独立细胞分析不同,空间数据让我们能够更全面地理解细胞,不仅考虑它们周围的局部环境,还包括它们在整个空间中的背景。在Seurat v5版本中,我们新增了对空间数据进行“生态位”分析的功能,这种分析可以识别出组织中的特定区域(即“生态位”),每个区域都有其独特的空间邻近细胞类型组合。这一方法受到了Goltsev等人在2018年发表于《细胞》杂志和He等人在2022年发表于《自然生物技术》杂志的研究方法的启发,我们为每个细胞定义了一个“局部邻域”,这包括了与其在空间上距离最近的k个邻居,并统计这个邻域内每种细胞类型的频率。接着,我们应用k均值聚类算法,将具有相似邻域特征的细胞归类到相同的空间生态位中。
在Seurat中,我们通过调用BuildNicheAssay函数来创建一个新的分析模块,称为“生态位”,它包含了每个细胞周围空间的细胞类型组成信息。此外,该函数还返回了一个元数据列“niches”,该列展示了基于生态位分析的细胞聚类结果。
xenium.obj <- BuildNicheAssay(object = xenium.obj, fov = "crop", group.by = "predicted.celltype",
    niches.k = 5, neighbors.k = 30)
然后,我们可以根据细胞类型身份或利基身份对细胞进行分组。确定的生态位清楚地划分了皮质中的神经元层。
celltype.plot <- ImageDimPlot(xenium.obj, group.by = "predicted.celltype", size = 1.5, cols = "polychrome",
    dark.background = F) + ggtitle("Cell type")
niche.plot <- ImageDimPlot(xenium.obj, group.by = "niches", size = 1.5, dark.background = F) + ggtitle("Niches") +
    scale_fill_manual(values = c("#442288", "#6CA2EA", "#B5D33D", "#FED23F", "#EB7D5B"))
celltype.plot | niche.plot
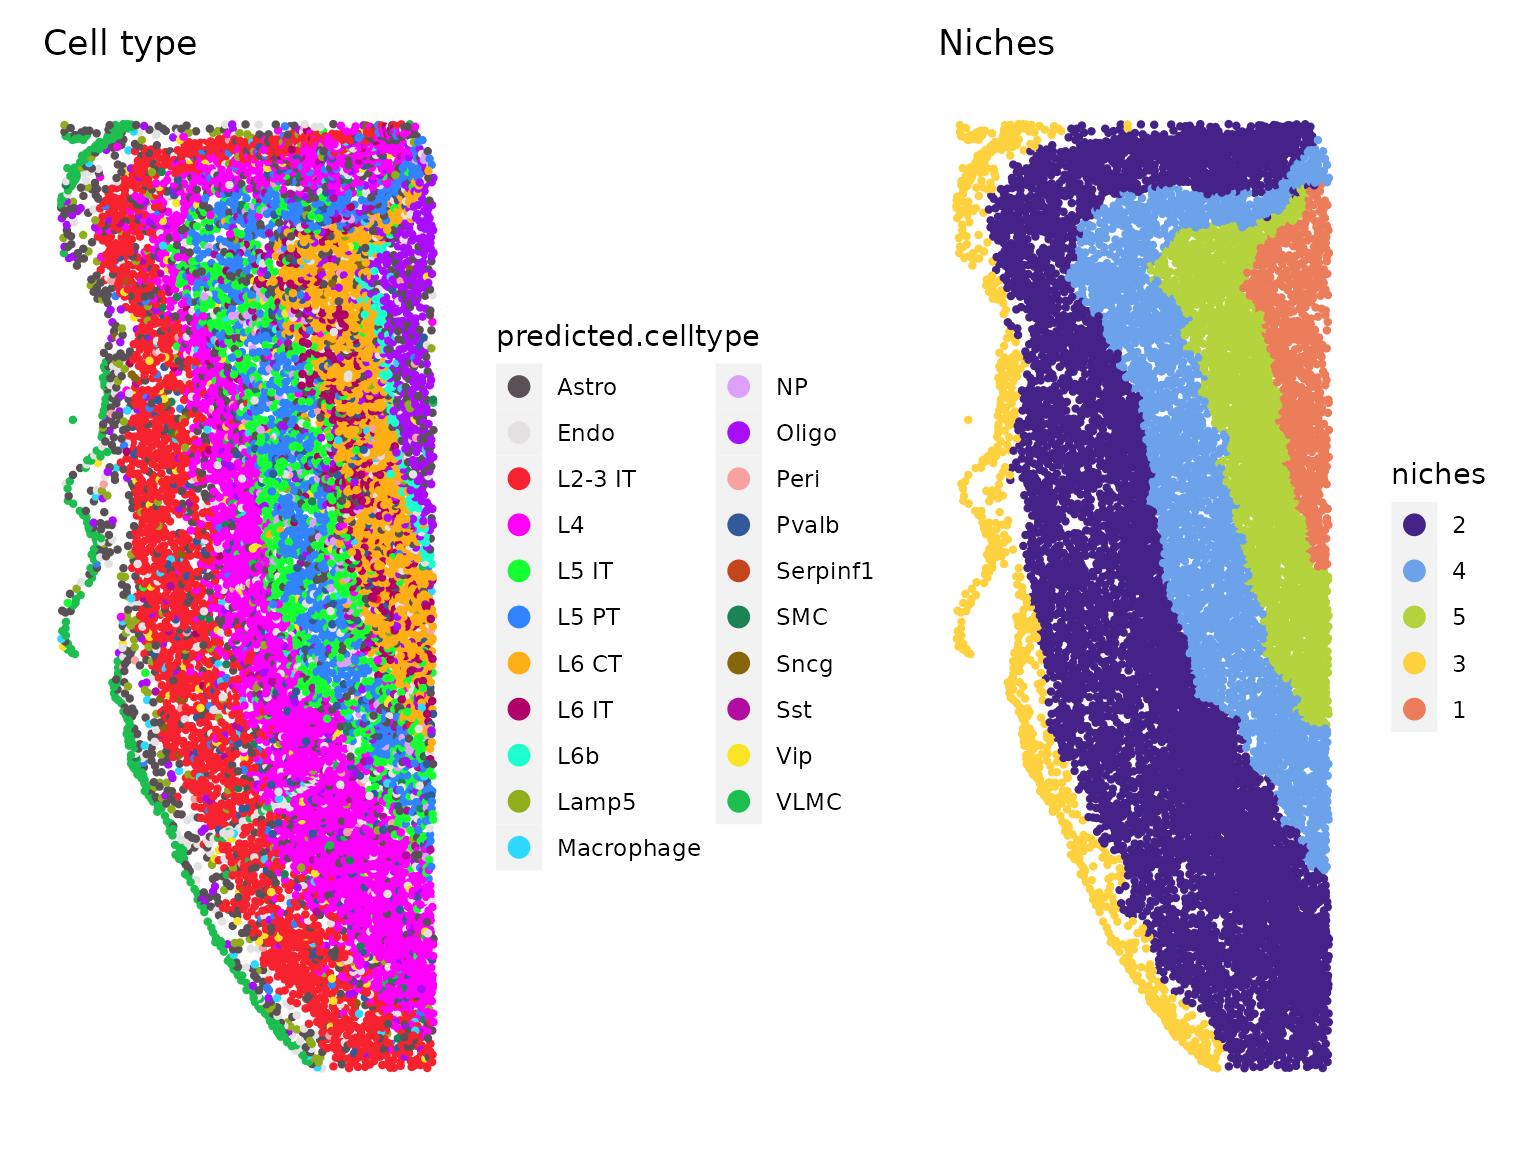
此外,我们观察到每个生态位的组成对于不同的细胞类型都是丰富的。
table(xenium.obj$predicted.celltype, xenium.obj$niches)

##
##                 1    2    3    4    5
##   Astro       115  484  241  146   89
##   Endo         27  250   66   62   45
##   L2-3 IT       0 1749   14    5    6
##   L4            2 2163    3   94   14
##   L5 IT         2   66    2  627   84
##   L5 PT         2   92    4  711   21
##   L6 CT        82    2    0   34  857
##   L6 IT         4   22    1   56  275
##   L6b          95    0    0    2    2
##   Lamp5         4   77   61    8    7
##   Macrophage    7   48   15   16   10
##   Meis2         0    0    0    0    0
##   NP            0    1    0   78    9
##   Oligo       305  130   42   76   70
##   Peri          6   40    4   10   12
##   Pvalb         5  155    0   75   54
##   Serpinf1      0    5    0    1    1
##   SMC           2   34    2   12    2
##   Sncg          3   15    1    0    5
##   Sst           0   53    0   55   26
##   Vip           3   85    5   14    4
##   VLMC          2   31  257    7    2
![]() 单细胞测序
702 人阅读
|
0 人回复
|
2024-06-25
单细胞测序
702 人阅读
|
0 人回复
|
2024-06-25