
一边学习,一边总结,一边分享!
本期教程
获得往期教程 Data and Code,请在后台回复:20240809。请大家看清楚回复关键词,每天都有很多人回复错误关键词,我这边没时间和精力一一回复。
2022年教程总汇

2023年教程总汇

2024年更新文档


Code
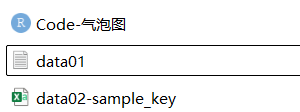
1. 此脚所需文件

2. 数据处理和计算
##'@导入所需的R包
library(tidyverse)
library(viridis)
library(reshape2)

#Import Data
#Data in COSMIC fit
data <- read.table(file="data01.txt",
                   header = TRUE, row.names = 1)

#Transpose so that each sample = 1 column
data <- as.data.frame(t(data))
#Convert Mutation Counts to Relative Contribution
data_relative <- scale(data, center = FALSE, scale = colSums(data))
head(colSums(data_relative))
#Restore Format
data_relative <- as.data.frame(t(data_relative))
data_relative <- tibble::rownames_to_column(data_relative, var="Samples")

#Import Sample Key
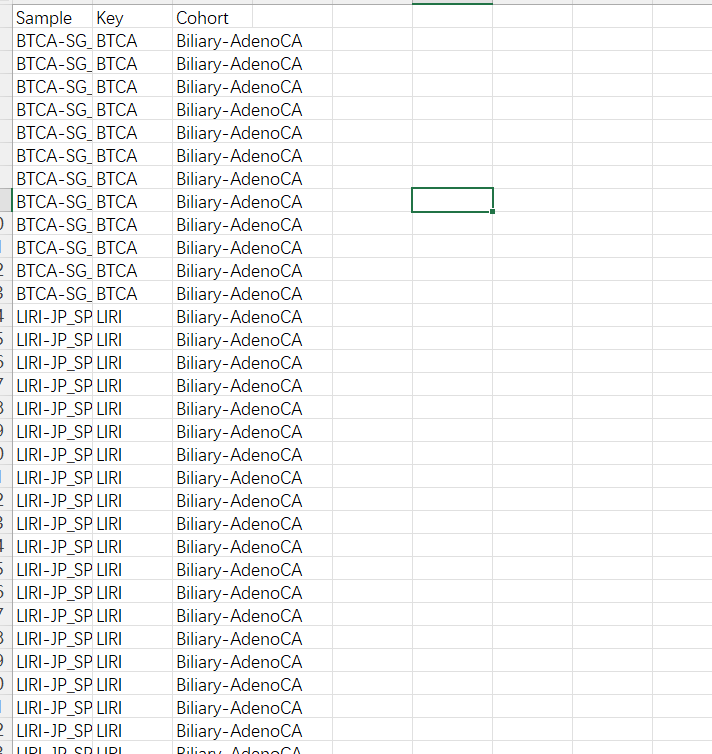
sample_key <- read.csv(file="data02-sample_key.csv")

data_relative=data_relative[order(data_relative$Samples),]
sample_key=sample_key[order(sample_key$Sample),]
data_relative$Cohort <- sample_key$Cohort[sample_key$Sample %in% data_relative$Samples]

#Remove Cohorts with less than 5 cases
data_relative <- filter(data_relative, Cohort != "Cervix-AdenoCA" & Cohort != "Breast-DCIS" & Cohort != "Myeloid-MDS")

#Select Columns to Plot
sbs40_data_relative <- as.data.frame(data_relative[,(c(1,48,47,49,64))])

#Create Proportions
sbs40_proportions <- sbs40_data_relative %>%
  group_by(Cohort) %>%
  summarise(
    SBS40a = sum(SBS40a >0)/n(),
    SBS40b = sum(SBS40b >0)/n(),
    SBS40c= sum(SBS40c >0)/n(),
  )

#Summarise (SBS40 Signatures, Relative)
summary <- sbs40_data_relative %>% group_by(Cohort) %>% summarise_if(is.numeric, mean)

#Melt
sbs40_proportions <- melt(sbs40_proportions)
summary_melt <- melt(summary)

#Combine
summary_melt$prop = sbs40_proportions$value
- 获得绘图数据
summary_melt。
> head(summary_melt)
           Cohort variable      value      prop
1 Biliary-AdenoCA   SBS40a 0.22762994 0.5428571
2     Bladder-TCC   SBS40a 0.04237746 0.1304348
3     Bone-Benign   SBS40a 0.08948290 0.2500000
4      Bone-Epith   SBS40a 0.28331677 0.6000000
5 Bone-Osterosarc   SBS40a 0.05965147 0.1714286
6  Breast-AdenoCA   SBS40a 0.23385891 0.6000000
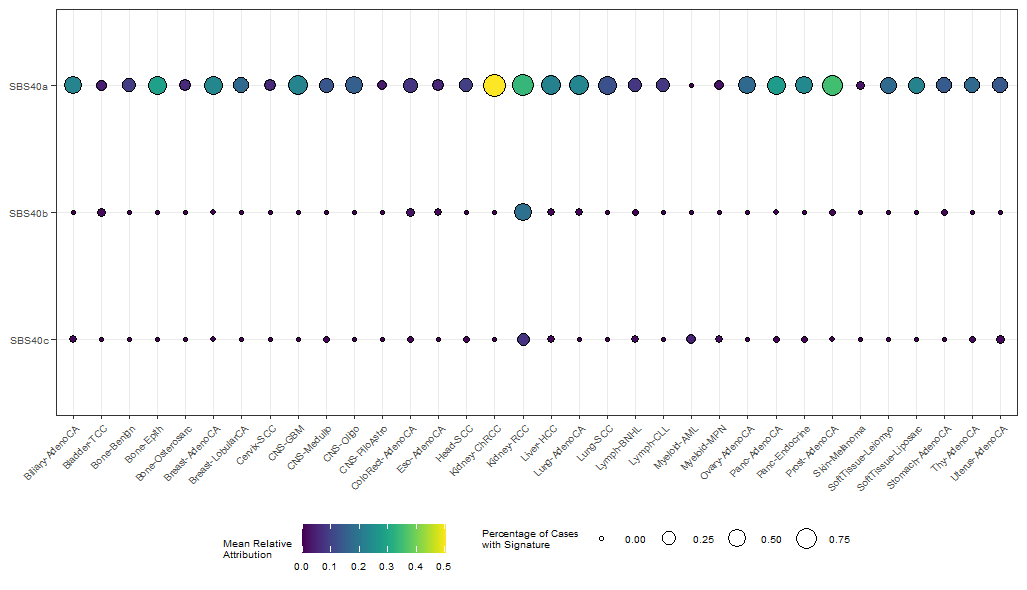
- 绘制基础图形
ggplot(summary_melt, aes(x = Cohort, y = fct_rev(variable))) +
  geom_point(aes(fill = value,  size = prop), color = "black", shape = 21) +
  scale_fill_viridis() +
  theme_bw() +
  theme(axis.title.x = element_blank()) +
  theme(axis.title.y = element_blank()) +
  theme(axis.text.x = element_text(angle = 45, hjust=1, size = 6)) +
  theme(axis.text.y = element_text(size = 6)) +
  labs(size="Percentage of Cases\nwith Signature", fill="Mean Relative\nAttribution") +
  theme(legend.position="bottom") +
  theme(legend.text=element_text(size=6)) +
  theme(legend.title=element_text(size=6))
- 使用
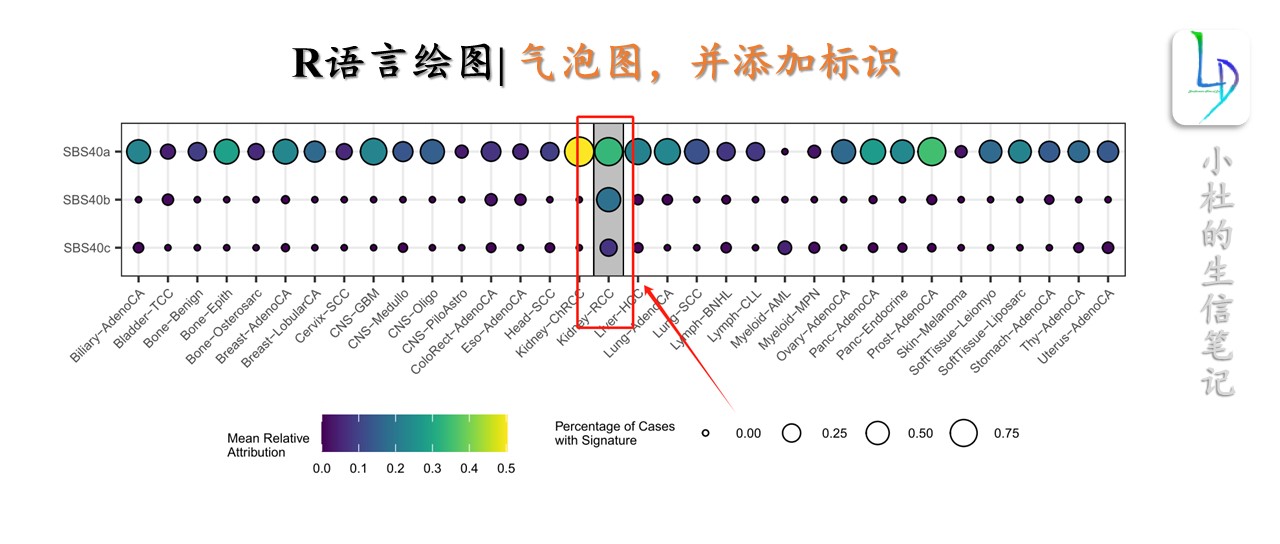
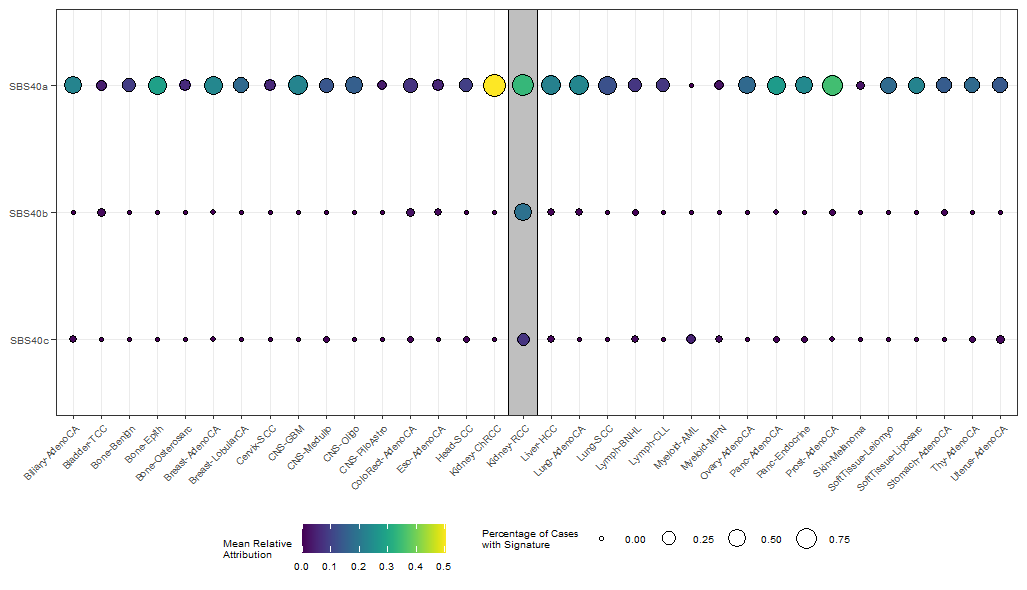
geom_rect(),添加标识。
ggplot(summary_melt, aes(x = Cohort, y = fct_rev(variable))) +
  ##'@添加灰色条带
  geom_rect(ymin = 0, ymax = 4, xmin = 16.5, xmax = 17.5,
            alpha = 1, color = "black", fill = "grey75", linewidth = 0.25) +
  ##
  geom_point(aes(fill = value,  size = prop), color = "black", shape = 21) +
  scale_fill_viridis() +
  theme_bw() +
  theme(axis.title.x = element_blank()) +
  theme(axis.title.y = element_blank()) +
  theme(axis.text.x = element_text(angle = 45, hjust=1, size = 6)) +
  theme(axis.text.y = element_text(size = 6)) +
  labs(size="Percentage of Cases\nwith Signature", fill="Mean Relative\nAttribution") +
  theme(legend.position="bottom") +
  theme(legend.text=element_text(size=6)) +
  theme(legend.title=element_text(size=6))
若我们的教程对你有所帮助,请 点赞+收藏+转发,这是对我们最大的支持。
往期部分文章
1. 最全WGCNA教程(替换数据即可出全部结果与图形)
2. 精美图形绘制教程
3. 转录组分析教程
4. 转录组下游分析
小杜的生信筆記 ,主要发表或收录生物信息学教程,以及基于R分析和可视化(包括数据分析,图形绘制等);分享感兴趣的文献和学习资料!!