EGAD 这个R包的安装需要用到bioconductor,设置国内镜像
https://mirrors.tuna.tsinghua.edu.cn/help/bioconductor/
先运行一下这行命令
options(BioC_mirror="https://mirrors.tuna.tsinghua.edu.cn/bioconductor")
基于基因表达矩阵构建共表达网络的代码来源于论文
Aggregated gene co-expression networks for predicting transcription factor regulatory landscapes in a non-model plant species
https://www.biorxiv.org/content/10.1101/2023.04.24.538042v1
这个论文应该是已经发表了,题目稍微修改了
Aggregated gene co-expression networks predict transcription factor regulatory landscapes in grapevine
https://academic.oup.com/jxb/article-abstract/74/21/6522/7260101?redirectedFrom=fulltext
代码链接
https://github.com/Tomsbiolab/non_agg_WGCN/tree/main
西红柿的基因表达矩阵和基因对应的GO注释来源于论文
Graph pangenome captures missing heritability and empowers tomato breeding

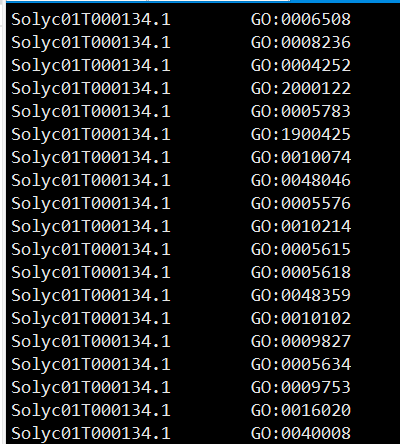
论文中提供的基因GO注释格式是这个格式,需要转换成下面的格式

两列 基因id 和 go
对表达矩阵的处理
表达矩阵里有5万多个基因,只选择Solyc开头的基因
library(data.table)
library(tidyverse)
fread("expression_raw_332.txt")%>%
select("target_id",matches("Solyc[0-9]"))%>%
column_to_rownames("target_id") -> raw.exp
exp.df<-raw.exp[,colSums(raw.exp > 0.5)>=100]
保留基因 至少在100个样本中的表达量大于0.5。这个表达量的格式是行是样本,列是基因
计算皮尔逊相关系数
pcc = cor(exp.df, method = "pearson")
write.table(pcc, file = "pcc.matrix", quote = F)
构建共表达网络
计算HRR矩阵
python computing_HRR_matrix_TOP420.py p pcc.matrix -o HRR.matrix -t 24

## 构建网络,这里两个脚本具体应该用哪一个暂时没有想明白
## 先用第一个吧

python ../top1_co_occurrence_matrix_version2_TOP420_removing_ties.py -p HRR.matrix -c non_agg_filtered_net_Cyto.csv non_agg_filtered_net_EGAD.csv
## 这一步的时间挺长的
运行EGAD
library(EGAD)
library(tidyverse)

net.dat<-read.table("Nature.tomato/non_agg_filtered_net_EGAD.csv",row.names = 1)
net.dat[net.dat>1] = 1

tomato.GO<-read_tsv("tomato.GO.table")
go.terms <- tomato.GO%>%pull(X2)%>%unique()

anno <- make_annotations(tomato.GO%>%as.data.frame(),gene_list,go.terms)

which(rowSums(anno) == 0) ## 每个基因都有go注释

GO_groups_voted <- run_GBA(network = net.dat%>%as.matrix(), anno)

## AUROCs的值

auc_GO_nv = GO_groups_voted[[1]][,1]

## 这里GO 对应这AUROCs的值,也并不是所有的anno里的go都有AUROCs的值
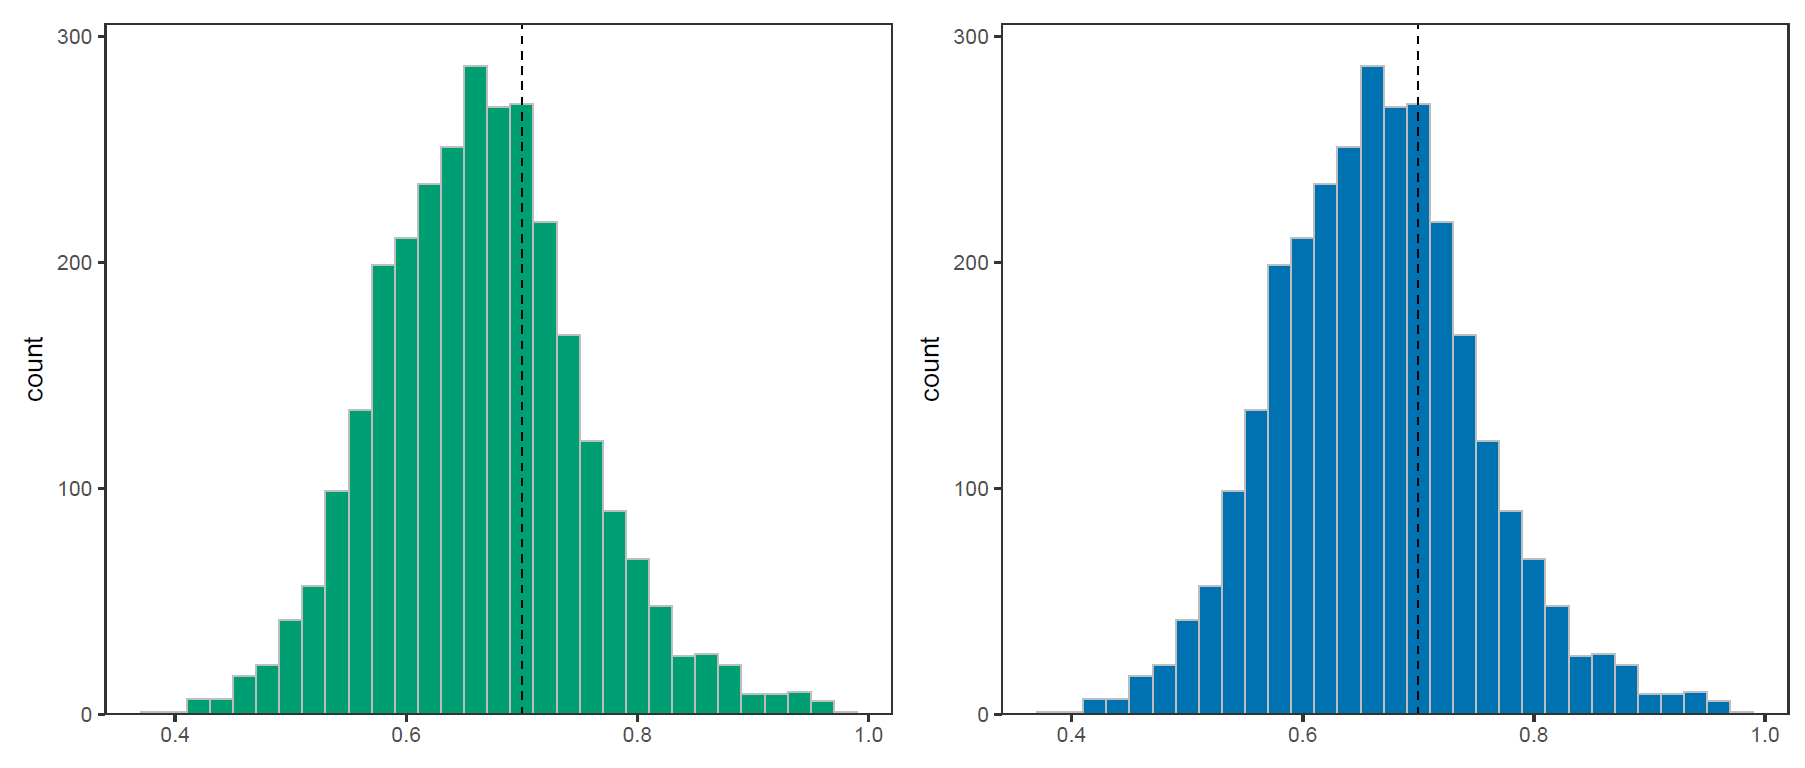
画个频率分布直方图吧
library(ggplot2)
load("C:/Users/xiaoming/Desktop/auroc.Rdata")
ggplot(data = auroc.dat,aes(x=X2))+
  geom_histogram(binwidth = 0.02,color="grey",
                 fill="#009f73")+
  theme_bw(base_size = 15)+
  theme(panel.grid = element_blank())+
  labs(x=NULL)+
  scale_y_continuous(expand = expansion(mult = c(0,0.02)),
                     limits = c(0,300))+
  geom_vline(xintercept = 0.7,lty="dashed")

欢迎大家关注我的公众号
小明的数据分析笔记本
小明的数据分析笔记本 公众号 主要分享:1、R语言和python做数据分析和数据可视化的简单小例子;2、园艺植物相关转录组学、基因组学、群体遗传学文献阅读笔记;3、生物信息学入门学习资料及自己的学习笔记!