 「一边学习,一边总结,一边分享!」
由于微信改版,一直有同学反映。存在长时间接收不到公众号的推文。那么请跟随以下步骤,将**「小杜的生信筆記」设置为「星标」,不错过每一条推文教程。**
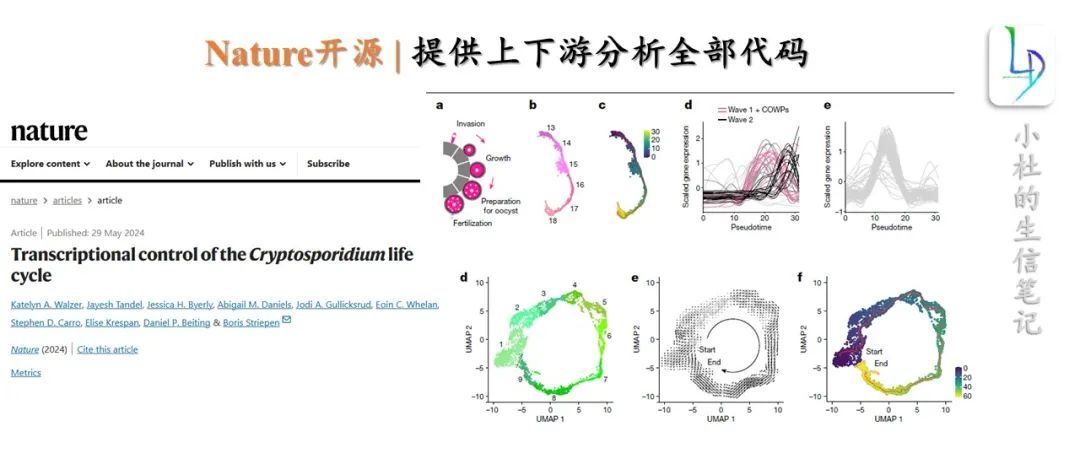
本期教程,我们提供的原文的译文,若有需求请回复关键词:20240530
本期教程
「小杜的生信笔记」,自2021年11月开始做的知识分享,主要内容是「R语言绘图教程」、「转录组上游分析」、**「转录组下游分析」等内容。凡是**在社群同学,可免费获得自2021年11月份至今全部教程,教程配备事例数据和相关代码,我们会持续更新中。
往期教程部分内容


RNA-seq上游分析
文章中使用kallisto软件进行mapped,与我们平时使用的软件有所差异。
「1. kallisto index」
#Use annotated transcripts file
kallisto index -i CryptoDB-46_CparvumIowaII_AnnotatedTranscripts.index CryptoDB-46_CparvumIowaII_AnnotatedTranscripts.fasta
「2. FastQC质控」
fastqc 13-MALE-KWJT_S13_mergedLanes_R1_001.fastq.gz -t 24 -o /venice/striepenlab/Katelyn_Walzer_data/Jayesh_manuscript/Male_Sort_CryptoDB46/fastqc
- 定量
kallisto quant -i CryptoDB-46_CparvumIowaII_AnnotatedTranscripts.index -o male_CryptoDB_46_rep_1 -t 24 -b 60 --single -l 400 -s 10013-MALE-KWJT_S13_mergedLanes_R1_001.fastq.gz
kallisto quant -i CryptoDB-46_CparvumIowaII_AnnotatedTranscripts.index -o male_CryptoDB_46_rep_2 -t 24 -b 60 --single -l 400 -s 10014-MALE-KWJT_S14_mergedLanes_R1_001.fastq.gz
RNA-seq下游分析
load packages ----
library(tidyverse)
library(tximport)
library(hrbrthemes)
library(RColorBrewer)
library(reshape2)
library(genefilter)
library(edgeR)
library(matrixStats)
library(DT)
library(gt)
library(plotly)
library(skimr)
library(limma)

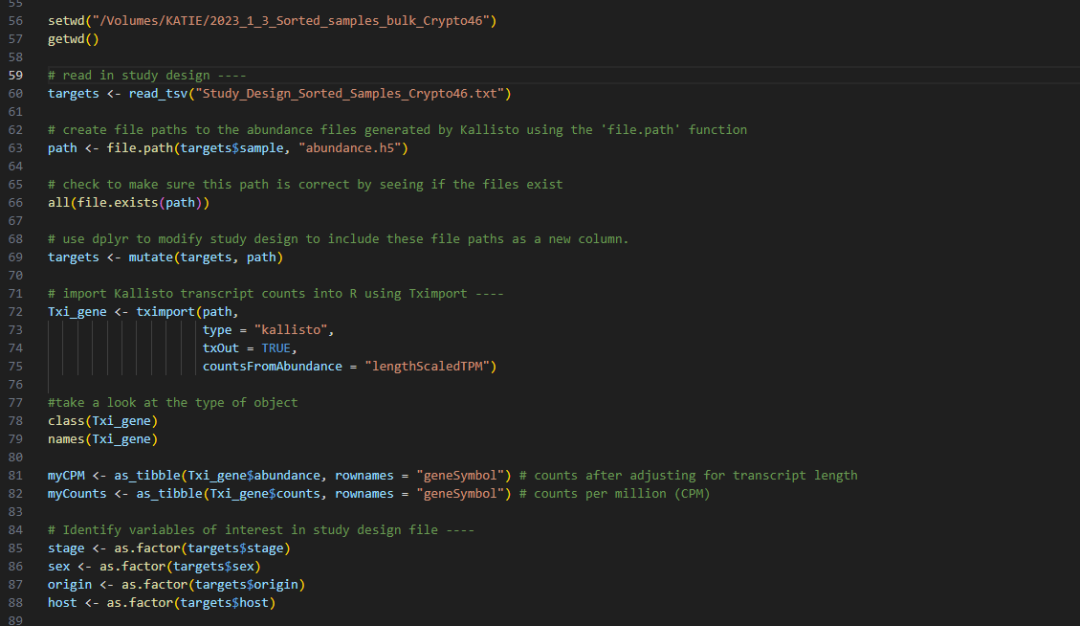
setwd("/Volumes/KATIE/2023_1_3_Sorted_samples_bulk_Crypto46")
getwd()
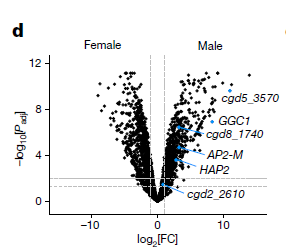
ggplot(M_vs_F_invivo_top_hits, aes(y=-log10(adj.P.Val), x=logFC, text = paste("Symbol:", geneSymbol))) +
  geom_point(size=4) +
  geom_point(mapping = NULL, AP2M_HAP2_subset_female_invivo, size = 4, colour = "#0095FF", inherit.aes = TRUE) +
  ylim(-0.5,12) +
  xlim(-15,15) +
  geom_hline(yintercept = -log10(0.01), linetype="dashed", colour="grey", size=0.5) +
  geom_hline(yintercept = -log10(0.05), linetype="dashed", colour="grey", size=1) +
  geom_vline(xintercept = 1, linetype="longdash", colour="grey", size=1) +
  geom_vline(xintercept = -1, linetype="longdash", colour="grey", size=1) +
  theme_bw() +
  #theme(panel.grid.major = element_blank(), panel.grid.minor = element_blank(), panel.background = element_blank(), panel.border = element_blank(), axis.line = element_line(colour = "black")) +
  theme(axis.text=element_text(size = 14),
        axis.title = element_text(size=16),
        plot.title=element_text(face = "bold", size = 20),
        plot.subtitle = element_text(size=16)) +
  labs(title="Male versus female in vivo")
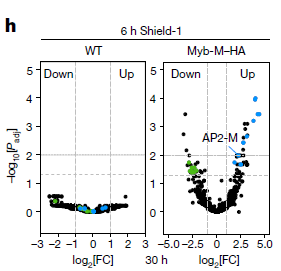
ggplot(WT_30hrs_hits, aes(y=-log10(adj.P.Val), x=logFC, text = paste("Symbol:", geneSymbol))) + geom_point(size=4) +
  geom_point(mapping = NULL, Asexual_genes_WT, size = 4, colour = "#4CBB17", inherit.aes = TRUE) +
  geom_point(mapping = NULL, Male_specific_genes_WT, size = 4, colour = "#0095FF", inherit.aes = TRUE) +
  ylim(-0.5,5) +
  xlim(-2.75,2.75) +
  geom_hline(yintercept = -log10(0.01), linetype="dashed", colour="grey", size=0.5) +
  geom_hline(yintercept = -log10(0.05), linetype="dashed", colour="grey", size=1) +
  geom_vline(xintercept = 1, linetype="longdash", colour="grey", size=1) +
  geom_vline(xintercept = -1, linetype="longdash", colour="grey", size=1) +
  theme_bw() +
  theme(plot.margin = margin(0.5, 15, 0.5, 0.5, "cm")) +
  theme(axis.text=element_text(size = 14),
        axis.title = element_text(size=16),
        plot.title=element_text(face = "bold", size = 20),
        plot.subtitle = element_text(size=16)) +
  labs(title="Effects of Shield treatment on wild type parasites")
scRNA-seq上游分析
「1. 将gff转为gtf」
gffread -E CryptoDB-46_CparvumIowaII.gff -T -o CryptoDB-46_CparvumIowaII.gtf
「2. 制作参考基因组」
# cellranger mkref --genome=output_genome --fasta=input.fa --genes=input.gtf
cellranger mkref --genome=Cryptosporidium_parvum_iowa_ii_EuPathDB46_Feb2020_ref --fasta=/data/striepenlab/Katelyn_Walzer_data/Single_Cell_Transcriptomics/Striepen_10x_Dec_2019/Cryptosporidium_parvum_ii_EuPathDB46/CryptoDB-46_CparvumIowaII_Genome.fasta --genes=/data/striepenlab/Katelyn_Walzer_data/Single_Cell_Transcriptomics/Striepen_10x_Dec_2019/Cryptosporidium_parvum_ii_EuPathDB46/CryptoDB-46_CparvumIowaII.gtf
「3. 转录组比对」
cellranger mkfastq --id=10x_fastq_files \
--run=/data/striepenlab/Katelyn_Walzer_data/Single_Cell_Transcriptomics/Striepen_10x_Feb_2020/2020_2_27_10x_BCL_files \
--csv=/data/striepenlab/Katelyn_Walzer_data/Single_Cell_Transcriptomics/Striepen_10x_Feb_2020/cellranger-KAW-bcl-simple-2020-2-27.csv \
--localcores=18
使用 CryptoDB 参考对 Crypto 样本进行细胞游离计数
「4. 进行单细胞基因表达定量」
cellranger count --id=crypto24_CryptoDB_only_1 \
--transcriptome=/data/striepenlab/Katelyn_Walzer_data/Single_Cell_Transcriptomics/Striepen_10x_Dec_2019/Cryptosporidium_parvum_iowa_ii_EuPathDB46_Feb2020_ref/ \
--fastqs=/data/striepenlab/Katelyn_Walzer_data/Single_Cell_Transcriptomics/Striepen_10x_Feb_2020/10x_fastq_files/outs/fastq_path/HV2NVBGXC/ \
--sample=crypto24hrs \
--expect-cells=4000 \
--localcores=18

cellranger count --id=crypto36_CryptoDB_only_1 \
--transcriptome=/data/striepenlab/Katelyn_Walzer_data/Single_Cell_Transcriptomics/Striepen_10x_Dec_2019/Cryptosporidium_parvum_iowa_ii_EuPathDB46_Feb2020_ref/ \
--fastqs=/data/striepenlab/Katelyn_Walzer_data/Single_Cell_Transcriptomics/Striepen_10x_Feb_2020/10x_fastq_files/outs/fastq_path/HV2NVBGXC/ \
--sample=crypto36hrs \
--expect-cells=6000 \
--localcores=18
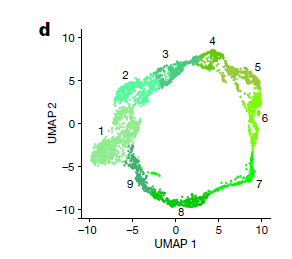
DimPlot(seurat.integrated_0.4, group.by = "cluster_labels", cols = c("lightgreen", "seagreen1", "seagreen3",
                                                                     "chartreuse3", "yellowgreen", "chartreuse1", "green1", "green3",
                                                                     "mediumseagreen"), pt.size = 2) +
                                                            FontSize(x.title = 20, y.title = 20) + NoLegend() + xlim(-10, 10)+ylim(-10, 10) + theme(axis.text=element_text(size = 16)) + ggtitle(NULL) +
                                                            coord_fixed(ratio = 1)

#With legend
DimPlot(seurat.integrated_0.4, group.by = "cluster_labels", cols = c("lightgreen", "seagreen1", "seagreen3",
                                                                     "chartreuse3", "yellowgreen", "chartreuse1", "green1", "green3",
                                                                     "mediumseagreen"), pt.size = 2) +
                                                            FontSize(x.title = 20, y.title = 20) + xlim(-10, 10)+ylim(-10, 10) + theme(axis.text=element_text(size = 16), legend.key.size = unit(0.6, 'cm'), legend.text=element_text(size=16)) + ggtitle(NULL) +
                                                            coord_fixed(ratio = 1)
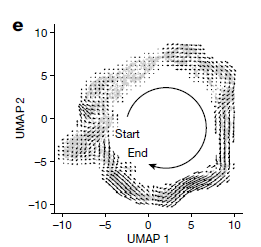
show.velocity.on.embedding.cor(emb = Embeddings(object = new.object.vel, reduction = "umap"), vel = Tool(object = new.object.vel,
                                                                                                         slot = "RunVelocity"), n = 200, scale = "sqrt", cell.colors = ac(x = cell.colors),
                               cex = 1, arrow.scale = 1.2, show.grid.flow = TRUE, min.grid.cell.mass = 0.5, grid.n = 40, arrow.lwd = 1,
                               do.par = FALSE, cell.border.alpha = 0, frame = FALSE)
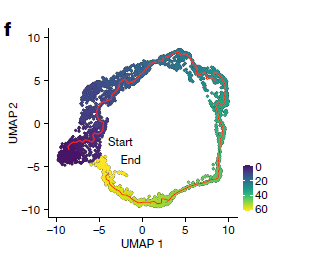
lot_cells(cds, color_cells_by = "pseudotime", cell_size = 2, trajectory_graph_color = "red", alpha = 1, trajectory_graph_segment_size = 1.2, label_branch_points = FALSE, label_roots = FALSE, label_leaves = FALSE) + NoLegend() + FontSize(x.title = 20, y.title = 20) + xlim(-10, 10)+ylim(-10, 10) + theme(axis.text=element_text(size = 16)) +
  viridis::scale_color_viridis(begin = 0.05, end = 1, option = "D") +
  theme(axis.line.y = element_line(size=0.5, color="black")) +
  theme(axis.text.x=element_text(colour="black")) +
  theme(axis.text.y=element_text(colour="black")) +
  coord_fixed(ratio = 1)

#With legend
plot_cells(cds, color_cells_by = "pseudotime", cell_size = 2, trajectory_graph_color = "red", alpha = 1, trajectory_graph_segment_size = 1.2, label_branch_points = FALSE, label_roots = FALSE, label_leaves = FALSE) + FontSize(x.title = 20, y.title = 20) + xlim(-10, 10)+ylim(-10, 10) + theme(axis.text=element_text(size = 16), legend.key.size = unit(1.5, 'cm'), legend.text=element_text(size=16), legend.title = element_blank()) +
  viridis::scale_color_viridis(begin = 0.05, end = 1, option = "D") +
  theme(axis.line.y = element_line(size=0.5, color="black")) +
  theme(axis.text.x=element_text(colour="black")) +
  theme(axis.text.y=element_text(colour="black")) +
  coord_fixed(ratio = 1)


pseudotime_start <- cds@principal_graph_aux@listData[["UMAP"]][["pseudotime"]]
seurat.integrated_0.4.updated <- AddMetaData(seurat.integrated_0.4.updated, metadata = pseudotime_start, col.name = "Pseudotime")

data_to_write_out <- as.data.frame(as.matrix([email]seurat.integrated_0.4.updated@meta.data[/email]))
fwrite(x = data_to_write_out, row.names = TRUE, file = "2023_1_19_Asexual_24hrs_36hrs_with_pseudotime.csv")
#Rename columns because ggplot does not like dashes
colnames(rhoptry_pseudotime_results_transposed) <- c("cgd4_1790", "cgd8_540", "cgd8_2530", "cgd4_2420", "cgd1_1870", "cgd2_370",
                                                     "cgd3_2010",  "cgd1_1380", "cgd1_950", "cgd2_2900", "cgd3_1330", "cgd3_1710",
                                                     "cgd3_1730", "cgd3_1770", "cgd3_1780", "cgd3_2750", "cgd3_910", "cgd5_20",
                                                     "cgd5_2760", "cgd6_1000", "cgd6_3630", "cgd6_3930", "cgd6_3940", "cgd8_520", "Pseudotime")

#Now plot, Extended Data Figure 3a
ggplot(rhoptry_pseudotime_results_transposed, aes(Pseudotime)) +
  stat_smooth(aes(y=cgd4_1790), fill=TRUE, colour="lightgray", se=FALSE, show.legend = TRUE) +
  stat_smooth(aes(y=cgd8_540), fill=TRUE, colour="lightgray", se=FALSE, show.legend = TRUE) +
  stat_smooth(aes(y=cgd8_2530), fill=TRUE, colour="lightgray", se=FALSE, show.legend = TRUE) +
  stat_smooth(aes(y=cgd4_2420), fill=TRUE, colour="lightgray", se=FALSE, show.legend = TRUE) +
  stat_smooth(aes(y=cgd1_1870), fill=TRUE, colour="lightgray", se=FALSE, show.legend = TRUE) +
  stat_smooth(aes(y=cgd2_370), fill=TRUE, colour="lightgray", se=FALSE, show.legend = TRUE) +
  stat_smooth(aes(y=cgd3_2010), fill=TRUE, colour="lightgray", se=FALSE, show.legend = TRUE) +
  stat_smooth(aes(y=cgd1_1380), fill=TRUE, colour="lightgray", se=FALSE, show.legend = TRUE) +
  stat_smooth(aes(y=cgd1_950), fill=TRUE, colour="lightgray", se=FALSE, show.legend = TRUE) +
  stat_smooth(aes(y=cgd2_2900), fill=TRUE, colour="lightgray", se=FALSE, show.legend = TRUE) +
  stat_smooth(aes(y=cgd3_1330), fill=TRUE, colour="lightgray", se=FALSE, show.legend = TRUE) +
  stat_smooth(aes(y=cgd3_1710), fill=TRUE, colour="lightgray", se=FALSE, show.legend = TRUE) +
  stat_smooth(aes(y=cgd3_1730), fill=TRUE, colour="lightgray", se=FALSE, show.legend = TRUE) +
  stat_smooth(aes(y=cgd3_1770), fill=TRUE, colour="lightgray", se=FALSE, show.legend = TRUE) +
  stat_smooth(aes(y=cgd3_1780), fill=TRUE, colour="lightgray", se=FALSE, show.legend = TRUE) +
  stat_smooth(aes(y=cgd3_2750), fill=TRUE, colour="lightgray", se=FALSE, show.legend = TRUE) +
  stat_smooth(aes(y=cgd3_910), fill=TRUE, colour="lightgray", se=FALSE, show.legend = TRUE) +
  stat_smooth(aes(y=cgd5_20), fill=TRUE, colour="lightgray", se=FALSE, show.legend = TRUE) +
  stat_smooth(aes(y=cgd5_2760), fill=TRUE, colour="lightgray", se=FALSE, show.legend = TRUE) +
  stat_smooth(aes(y=cgd6_1000), fill=TRUE, colour="lightgray", se=FALSE, show.legend = TRUE) +
  stat_smooth(aes(y=cgd6_3630), fill=TRUE, colour="lightgray", se=FALSE, show.legend = TRUE) +
  stat_smooth(aes(y=cgd6_3930), fill=TRUE, colour="lightgray", se=FALSE, show.legend = TRUE) +
  stat_smooth(aes(y=cgd6_3940), fill=TRUE, colour="lightgray", se=FALSE, show.legend = TRUE) +
  stat_smooth(aes(y=cgd8_520), fill=TRUE, colour="lightgray", se=FALSE, show.legend = TRUE) +
  stat_smooth(data = mean_gene_groups_pseudotime, aes(y=Rhoptry), level = 0.95, colour="black", fill = "red1", show.legend = TRUE) +
  theme_bw() +
  theme(panel.grid.major = element_blank(), panel.grid.minor = element_blank(), panel.background = element_blank(), panel.border = element_blank(), axis.line = element_line(colour = "black"), plot.margin = margin(0.5, 0.5, 0.5, 0.5, "cm")) +
  scale_x_continuous(expand=c(0,0)) +
  ylab("Scaled Gene Expression") +
  theme(legend.title = element_blank()) +
  theme(axis.text.x=element_text(colour="black")) +
  theme(axis.text.y=element_text(colour="black")) +
  theme(axis.text=element_text(size = 28),
        axis.title = element_text(size=32),
        plot.title=element_text(face = "bold", size = 20),
        legend.text = element_text(size=16))
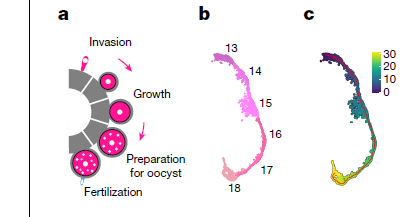
文中提供了详细代码,可以自己对照原文进行查看。
本期教程,我们提供的原文的译文,若有需求请回复关键词:20240530
若我们的教程对你有所帮助,请点赞+收藏+转发,这是对我们最大的支持。
往期部分文章
「1. 最全WGCNA教程(替换数据即可出全部结果与图形)」
「2. 精美图形绘制教程」
「3. 转录组分析教程」
「4. 转录组下游分析」
「小杜的生信筆記」 ,主要发表或收录生物信息学教程,以及基于R分析和可视化(包括数据分析,图形绘制等);分享感兴趣的文献和学习资料!!