这个地图是带地形的,数据下载链接
https://www.naturalearthdata.com/downloads/
可以只画自己指定的区域,比如我大体画一下河北省的地形
nat.earth<-raster::brick("figure1/NE2_HR_LC_SR_W_DR.tif")
raster::crop(nat.earth,  raster::extent(c(113,120,36,43))) -> tmp.dat

ggplot()+
  ggspatial::layer_spatial(tmp.dat)
extent()函数里是经度范围和纬度范围
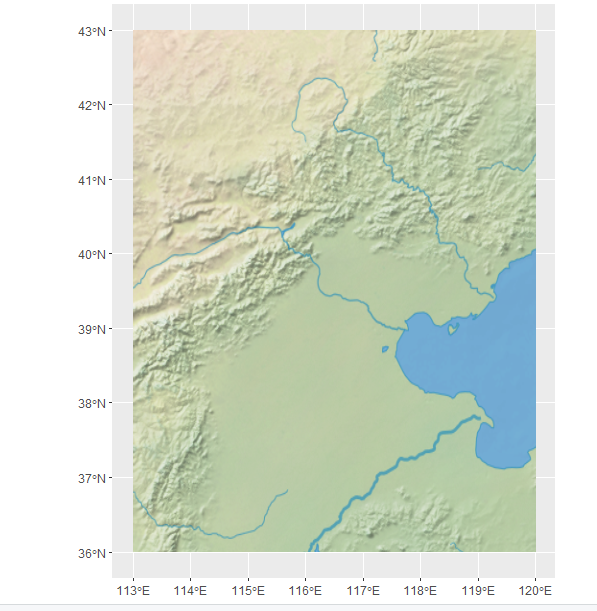
这里是有主要河流信息的
但是没有各省的边界信息,我想添加一个河北省的省界
read_sf("D:/R_4_1_0_working_directory/env001/REN/china.geojason") %>%
  filter(name=="河北省") -> hebei.df


ggplot()+
  ggspatial::layer_spatial(tmp.dat)+
  geom_sf(data=hebei.df,fill="white",color="black")
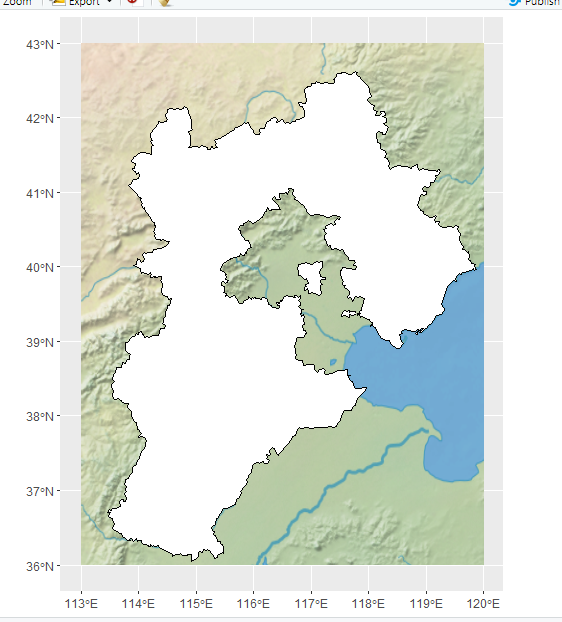
如果想添加一些河流信息的话,之前有一篇推文进行了介绍
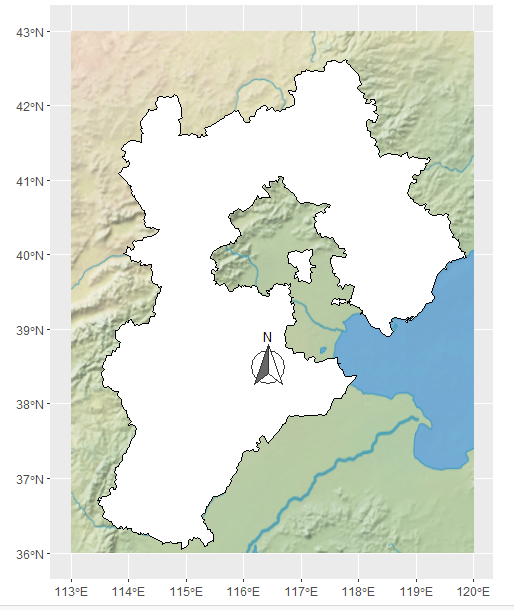
添加指北的箭头
ggplot()+
  ggspatial::layer_spatial(tmp.dat)+
  geom_sf(data=hebei.df,fill="white",color="black")+
  annotation_north_arrow(location="bl",
                         style = north_arrow_fancy_orienteering(
                           fill = c("grey40","white"),
                           line_col = "grey20"),
                         pad_x = unit(5,'cm'),
                         pad_y = unit(5,'cm'))
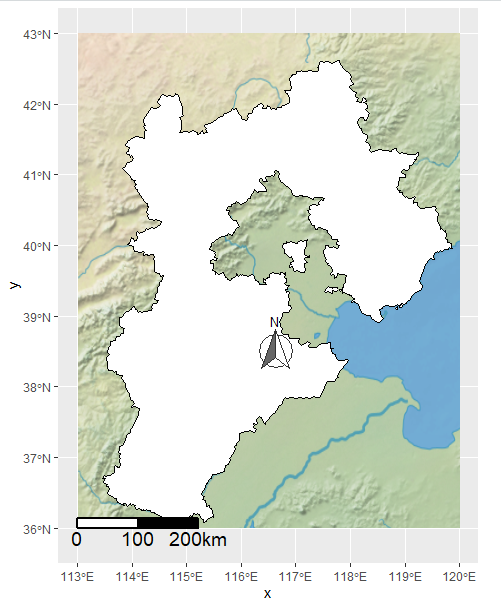
添加比例尺
ggplot()+
  ggspatial::layer_spatial(tmp.dat)+
  geom_sf(data=hebei.df,fill="white",color="black")+
  annotation_north_arrow(location="bl",
                         style = north_arrow_fancy_orienteering(
                           fill = c("grey40","white"),
                           line_col = "grey20"),
                         pad_x = unit(5,'cm'),
                         pad_y = unit(5,'cm'))+
  ggsn::scalebar(x.min = 113,
                 x.max = 120,
                 y.min = 36,
                 y.max = 43,
                 location = "bottomleft",
                 transform = TRUE,
                 dist_unit = "km",
                 dist = 100)
复现论文的代码的时候遇到报错
cannot transform sfc object with missing crs
和这个问题一样
https://stackoverflow.com/questions/70989790/resolving-this-error-cannot-transform-sfc-object-with-missing-crs
单独作图没有问题,和后面的代码进行组合就会报错,暂时搞不懂什么原因。做地图的这些数据的格式以及坐标转换这些不懂,这应该是涉及到地理相关的一下知识了。
参考 https://stackoverflow.com/questions/50232331/set-the-right-crs-on-sf-object-to-plot-coordinate-points
运行代码
st_crs(coastline)<-"+proj=longlat +datum=WGS84 +no_defs +ellps=WGS84 +towgs84=0,0,0"
可以解决
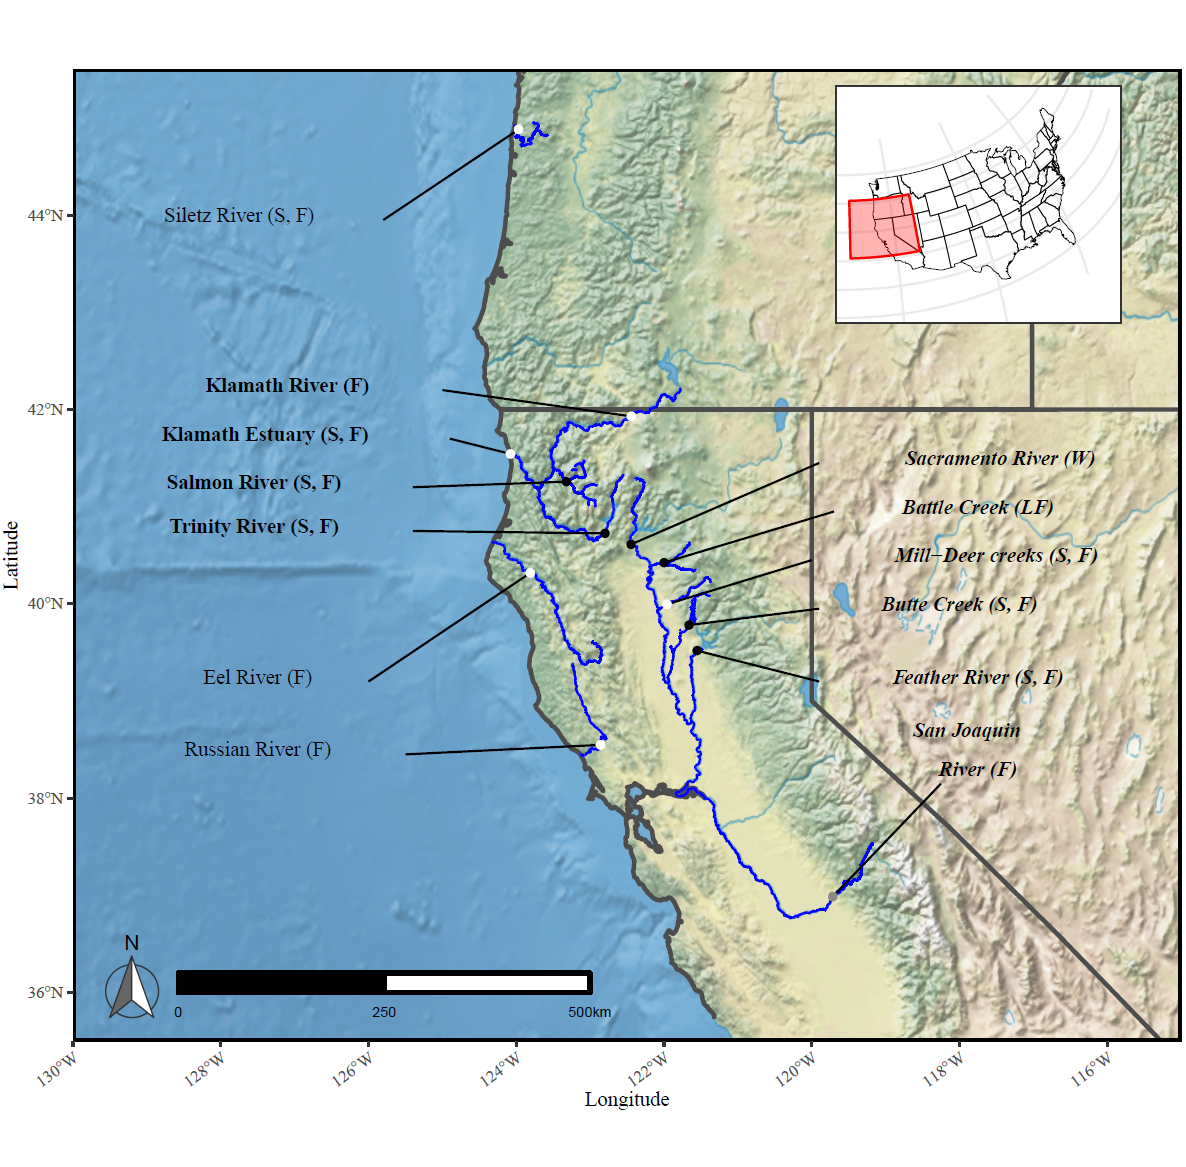
完整复现代码
library(raster)
library(sf)
library(tidyverse)
library(ggspatial)
#install.packages("ggsn")
#devtools::install_github('oswaldosantos/ggsn')
library(ggsn)
library(cowplot)


nat.earth<-raster::brick("figure1/NE2_HR_LC_SR_W_DR.tif")
state_prov<-sf::st_read("figure1/ne_10m_admin_1_states_provinces_lines.shp")

st_crs(state_prov)<-"+proj=longlat +datum=WGS84 +no_defs +ellps=WGS84 +towgs84=0,0,0"

coastline<-sf::st_read("figure1/ne_10m_coastline.shp")
st_crs(coastline)<-"+proj=longlat +datum=WGS84 +no_defs +ellps=WGS84 +towgs84=0,0,0"

load("figure1/rivers.rda")


cali_rivers_repro <- sf::st_transform(cali_rivers, "+proj=longlat +datum=WGS84 +no_defs +ellps=WGS84 +towgs84=0,0,0")
siletz_repro <- sf::st_transform(siletz, "+proj=longlat +datum=WGS84 +no_defs +ellps=WGS84 +towgs84=0,0,0")
salmon_repro <- sf::st_transform(salmon, "+proj=longlat +datum=WGS84 +no_defs +ellps=WGS84 +towgs84=0,0,0")
battle_repro <- sf::st_transform(battle, "+proj=longlat +datum=WGS84 +no_defs +ellps=WGS84 +towgs84=0,0,0")
butte_repro <- sf::st_transform(butte, "+proj=longlat +datum=WGS84 +no_defs +ellps=WGS84 +towgs84=0,0,0")
deer_repro <- sf::st_transform(deer, "+proj=longlat +datum=WGS84 +no_defs +ellps=WGS84 +towgs84=0,0,0")


domain <- c(
  xmin = -130,
  xmax = -115,
  ymin = 35.5,
  ymax = 45.5
)


nat.crop <- raster::crop(nat.earth,  raster::extent(domain))
state.subset <- sf::st_crop(state_prov, domain)
coastline_cropped <- sf::st_crop(coastline, domain)
cali2plot <- sf::st_crop(sf::st_zm(cali_rivers_repro), domain)
rosa_rivers <- cali2plot %>%
  filter(GNIS_Name %in% c(
    "Sacramento River", "Russian River", "Eel River", "Trinity River",
    "Klamath River", "San Joaquin River", "Feather River"
  ))

fish_sites <- read_csv("figure1/100-RoSA_sample_sites.csv")


ggplot()+
  ggspatial::layer_spatial(nat.crop)+
  geom_sf(data = state.subset, color = "gray30", fill = NA,linewidth=1)+
  geom_sf(data = coastline_cropped, color = "gray30", fill = NA,linewidth=1)+
  geom_sf(data = rosa_rivers, colour = "blue", size = 0.5)+
  geom_sf(data = st_zm(siletz_repro), colour = "blue", size = 0.5) +
  geom_sf(data = salmon_repro %>% st_zm(), colour = "blue", size = 0.5)+
  geom_sf(data = battle_repro %>% st_zm(), colour = "blue", size = 0.5) +
  geom_sf(data = butte_repro %>% st_zm(), colour = "blue", size = 0.5) +
  geom_sf(data = deer_repro %>% st_zm(), colour = "blue", size = 0.5) +
  geom_text(data = fish_sites, aes(x = name_long, y = name_lat, label = pop,
                                   family = "serif", fontface = font_type), size = 3.5)+
  geom_segment(data = fish_sites %>% filter(!pop %in% c("San Joaquin", "River (F)")),
               mapping = aes(x = line_long, xend = longitude, y = name_lat - 0.05, yend = latitude), size = 0.5) +
  geom_segment(data = fish_sites %>% filter(pop == "San Joaquin"),
               mapping = aes(x = line_long, xend = longitude, y = name_lat - 0.55, yend = latitude), size = 0.5) +
  geom_point(data = fish_sites, mapping = aes(x = longitude, y = latitude),
             fill = fish_sites$color2, colour = fish_sites$color2) +
  scale_x_continuous(expand = c(0, 0)) +
  xlab("Longitude") +
  scale_y_continuous("Latitude", expand = c(0, 0)) +
  coord_sf(xlim = domain[1:2], ylim = domain[3:4]) +
  scalebar(
    x.min = domain[1], x.max = domain[2], y.min = domain[3], y.max = domain[4],
    location = "bottomright", model = "WGS84", dist = 250,
    anchor = c(x = -123, y = 36), st.size = 2.5, transform = TRUE, dist_unit = "km"
  ) +
  theme_bw() +
  theme(
    panel.border = element_rect(colour = "black", size = 1),
    axis.text.x = element_text(size = 8, family = "serif", angle = 35, hjust = 1),
    axis.text.y = element_text(size = 8, family = "serif"),
    axis.title.y = element_text(family = "serif", size = 10),
    axis.title.x = element_text(family = "serif", vjust = 2, size = 10),
    plot.margin = margin(0, 0.1, 0, 0.15, "cm"),
    legend.position = "none"
  )+
  annotation_north_arrow(location="bl",
                         style = north_arrow_fancy_orienteering(
                           fill = c("grey40","white"),
                           line_col = "grey20")) -> base_map


base_map

wrld <- map_data("state")
domain_df <- data_frame(point = 1:length(domain),
                        long = rep(domain[1:2], each = 2),
                        lat = c(domain[3:4],
                                rev(domain[3:4])))
inset_world <- ggplot() +
  geom_path(data = wrld, aes(x = long, y = lat, group = group), colour = "black", size = 0.1) +
  geom_polygon(data = domain_df, mapping = aes(x = long, y = lat), colour = "red", fill = "red", alpha = 0.3) +
  coord_map("ortho", orientation = c(41, -132, 0)) +
  theme_bw() +
  labs(x = NULL, y = NULL) +
  theme(
    axis.title = element_blank(),
    axis.text = element_blank(),
    axis.ticks = element_blank(),
    plot.margin = unit(c(0, 0, -1, -1), "mm")
  )

inset_world

final_map <- ggdraw() +
  draw_plot(base_map) +
  draw_plot(inset_world, x = 0.7, y = 0.725, width = 0.25, height = 0.2)

final_map
欢迎大家关注我的公众号
小明的数据分析笔记本
小明的数据分析笔记本 公众号 主要分享:1、R语言和python做数据分析和数据可视化的简单小例子;2、园艺植物相关转录组学、基因组学、群体遗传学文献阅读笔记;3、生物信息学入门学习资料及自己的学习笔记!