1. 通过逻辑回归(logistic regression)建立分类模型
1.1 逻辑回归可视化和条件概率
激活函数 (activation function): 一种函数(如 ReLU 或 S 型函数),用于对上一层的所有输入进行求加权和,然后生成一个输出值(通常为非线性值)传递给下一层。
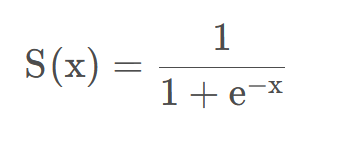
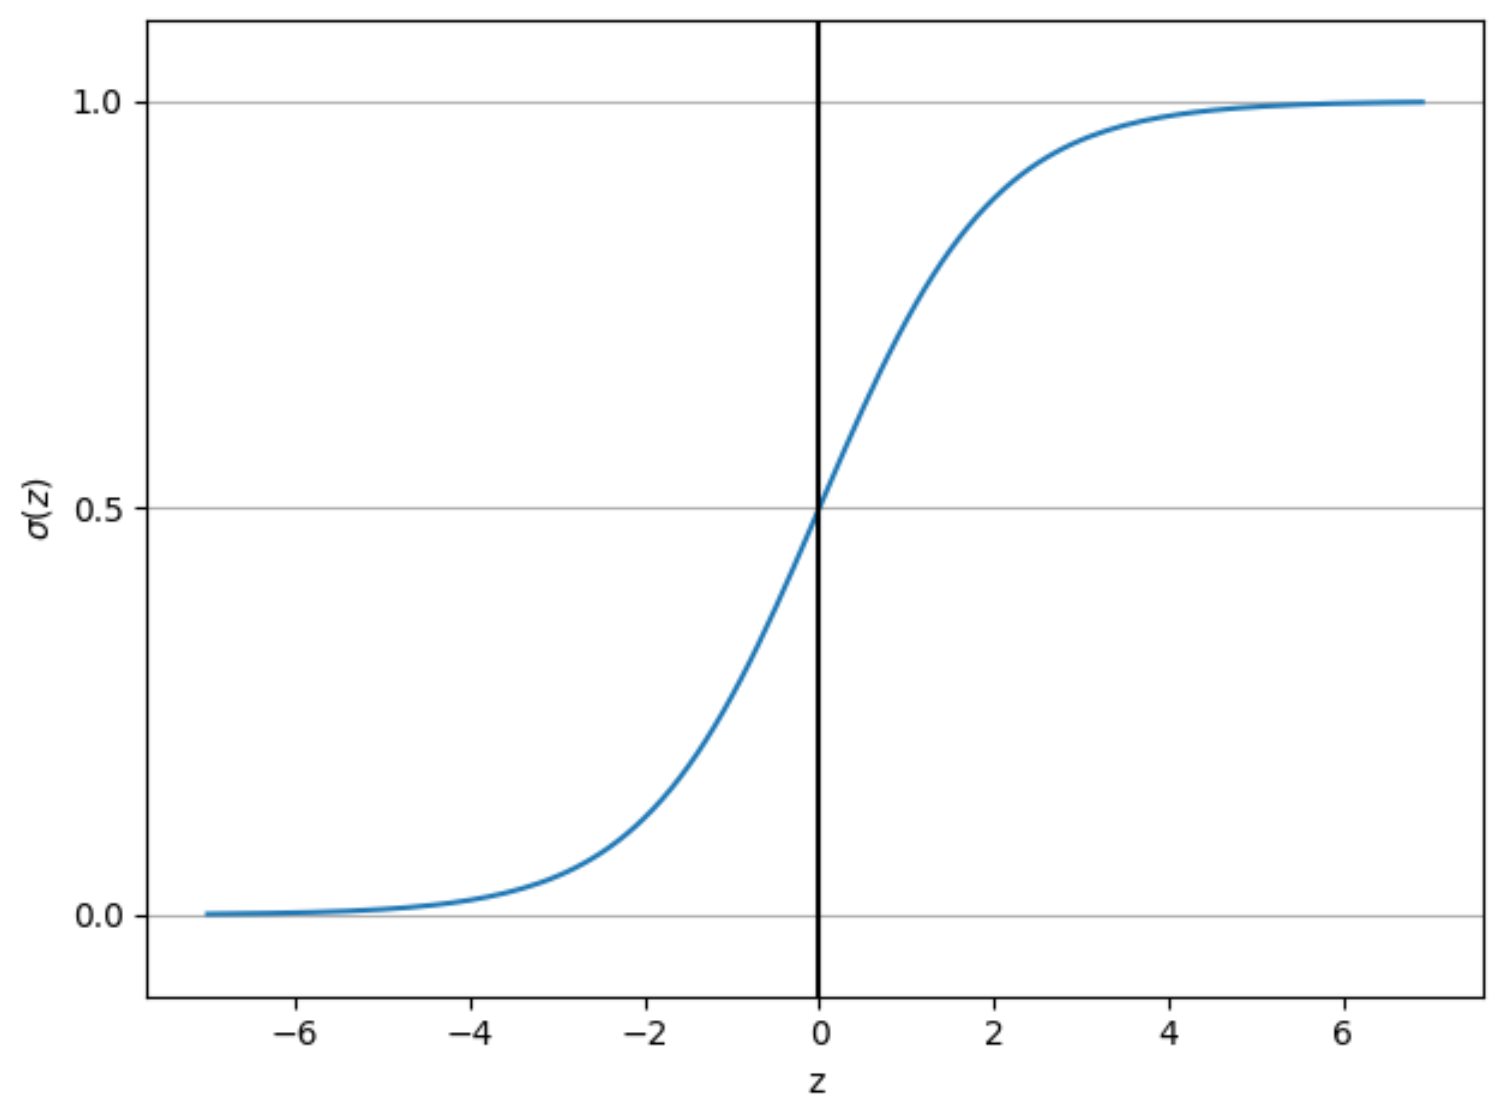
Sigmoid函数是一个在生物学中常见的S型函数,常被用作神经网络的激活函数,将变量映射到[0,1]之间,函数公式如下:
import matplotlib.pyplot as plt
import numpy as np

# 激活函数
def sigmoid(z):
    return 1.0 / (1.0 + np.exp(-z))

# 生成从-7开始到7(但不包括7)且步长为0.1的等差数列
z = np.arange(-7, 7, 0.1)
# 使用激活函数sigmoid将上述等差数量映射到0-1
sigma_z = sigmoid(z)

# 绘图
plt.plot(z, sigma_z)
plt.axvline(0.0, color='k')
plt.ylim(-0.1, 1.1)
plt.xlabel('z')
plt.ylabel('$\sigma (z)$')

# Y轴坐标间隔和范围
plt.yticks([0.0, 0.5, 1.0])
ax = plt.gca()
# Y轴添加网格线
ax.yaxis.grid(True)

plt.tight_layout()
plt.show()
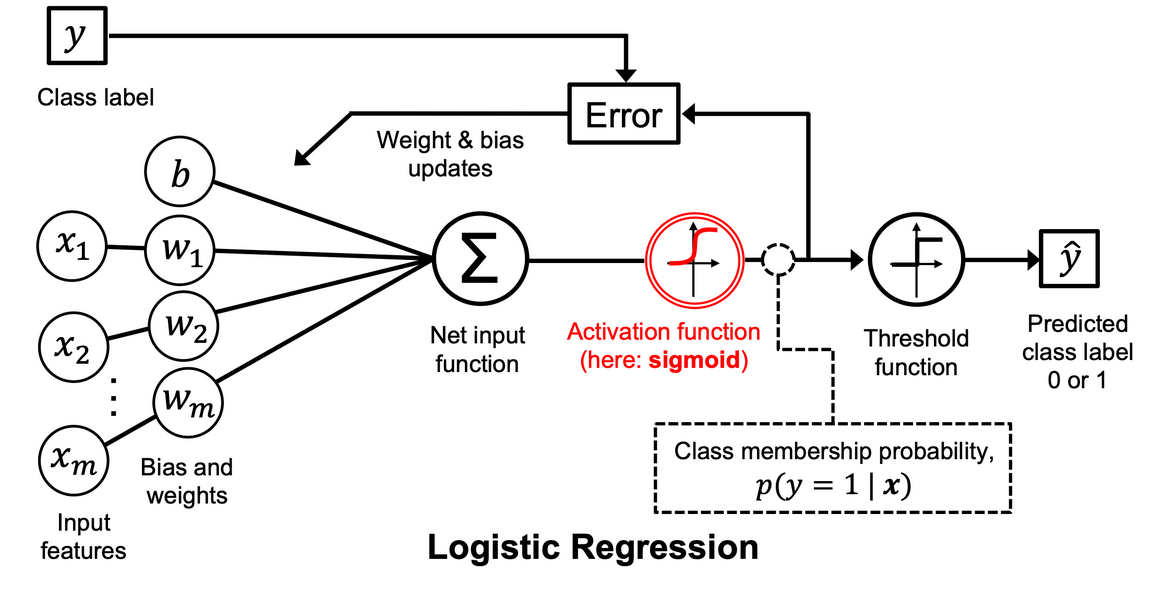
1.2 逻辑回归工作流程图
1.3 逻辑损失函数的权重
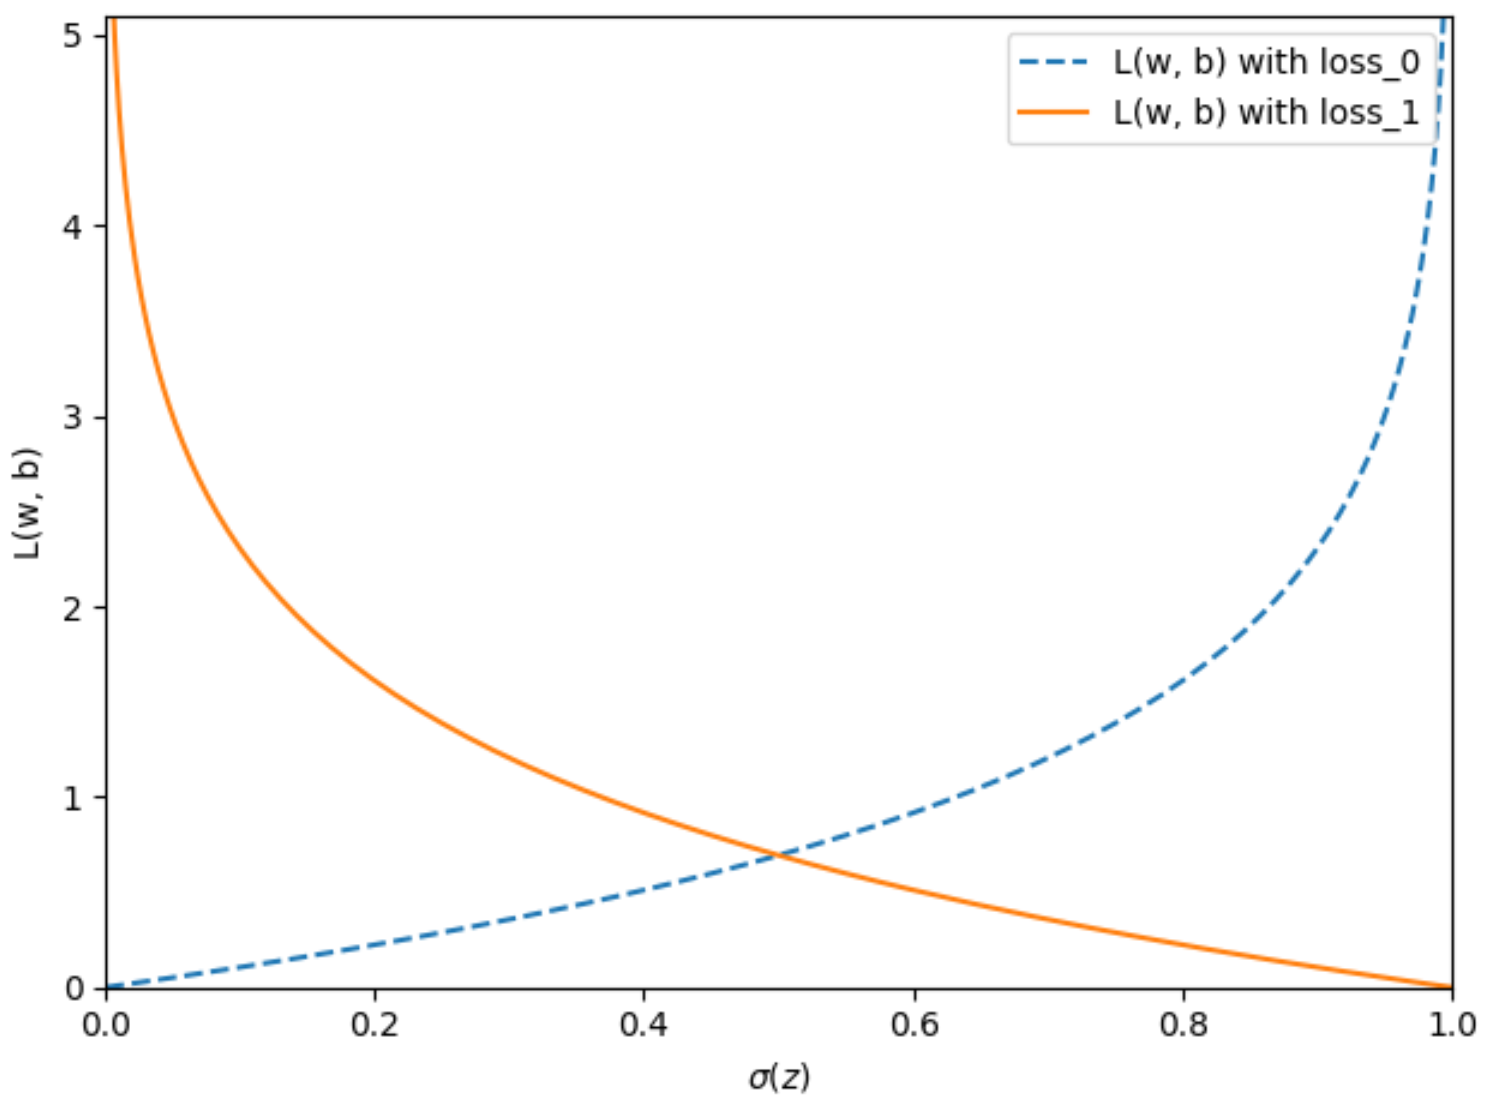
损失 (Loss):一种衡量模型的预测结果与偏离真实标签的衡量指标,例如在线性回归模型中通常采用均方误差作为loss function, 逻辑回归模型则使用对数损失函数作为loss function。
# 定义2个对数损失函数
def loss_0(z):
    return - np.log(1 - sigmoid(z))

def loss_1(z):
    return - np.log(sigmoid(z))

z = np.arange(-10, 10, 0.1)
sigma_z = sigmoid(z)

# loss_0函数可视化
c0 = [loss_0(x) for x in z]
plt.plot(sigma_z, c0, linestyle='--', label='L(w, b) with loss_0')

# loss_1函数可视化
c1 = [loss_1(x) for x in z]
plt.plot(sigma_z, c1, label='L(w, b) with loss_1')

plt.ylim(0.0, 5.1)
plt.xlim([0, 1])
plt.xlabel('$\sigma(z)$')
plt.ylabel('L(w, b)')
plt.legend(loc='best')
plt.tight_layout()
plt.show()
2. 基于梯度下降算法的逻辑回归分类器模型
批次 (batch):机器学习模型训练的一次迭代(即完成一次梯度更新)中使用的样本集。
批次规模 (batch size):一个批次batch中的样本数, 例如SGD 的批次规模为 1,而小批次的规模通常介于 10 到 1000 之间,在模型训练时batch size通常时固定的。
周期 (epoch):在训练时,整个数据集的一次完整遍历,以便不漏掉任何一个样本。即epoch = sample number / batch size,其中sample number为样本总数,batch size为批次规模。
# 定义类
from matplotlib.colors import ListedColormap
import matplotlib.pyplot as plt
from distutils.version import LooseVersion
import matplotlib.pyplot as plt
import numpy as np

class LogisticRegressionGD:
    """
    参数
    ------------
    eta : float
      Learning rate :学习速率(0-1之间)

    n_iter : int
      传递训练数据集个数,即批次规模

    random_state : int
      随机数种子生成器权重

    属性
    -----------
    w_ : 1d-array
      训练权重
    b_ : Scalar
      fitting偏差.
    losses_ : list
      每个周期的逻辑回归函数数值.

    """
    def __init__(self, eta=0.01, n_iter=50, random_state=1):
         # 默认学习速率0.01, 批次规模50个样本
        self.eta = eta
        self.n_iter = n_iter
        self.random_state = random_state

    def fit(self, X, y):
        """ 适配训练数据

        参数
        ----------
        X : {array-like}, shape = [n_examples, n_features]
          训练向量,n_examples表示样本数量,n_features 表示特征数量
        y : array-like, shape = [n_examples]
          分类标签向量,包含真实的样本标签

        返回值
        -------
        LogisticRegressionGD实例

        """
        rgen = np.random.RandomState(self.random_state)
       # 生成一个正态分布的随机数组,并将其赋值给 self.w_
       # loc=0.0 表示正态分布的均值(mean)是 0.0
       # scale=0.01 表示正态分布的标准差(standard deviation)是 0.01
       # size=X.shape[1] 表示生成的随机数组的大小(即长度或元素数量)应该与输入数据 X 的特征数量(列数)相同
        self.w_ = rgen.normal(loc=0.0, scale=0.01, size=X.shape[1])
        self.b_ = np.float_(0.)
        self.losses_ = []

        for i in range(self.n_iter):
            net_input = self.net_input(X)
            output = self.activation(net_input)
            errors = (y - output)
            self.w_ += self.eta * X.T.dot(errors) / X.shape[0]
            self.b_ += self.eta * errors.mean()
            loss = (-y.dot(np.log(output)) - (1 - y).dot(np.log(1 - output))) / X.shape[0]
            self.losses_.append(loss)
        return self

    def net_input(self, X):
        """计算神经网络输入值,返回2个数组的点积+b_"""
        return np.dot(X, self.w_) + self.b_

    def activation(self, z):
        """计算逻辑回归激活函数结果"""
        # 通过np.clip(z, -250, 250)将z数值限制在-250~250之间,防止溢出
        return 1. / (1. + np.exp(-np.clip(z, -250, 250)))

    def predict(self, X):
        """返回分类标签预测结果,激活函数结果大于等于0.5则分类为标签1,否则为0"""
        return np.where(self.activation(self.net_input(X)) >= 0.5, 1, 0)

def plot_decision_regions(X, y, classifier, test_idx=None, resolution=0.02):
    # 绘图图形和颜色生成
    markers = ('o', 's', '^', 'v', '<')
    colors = ('red', 'blue', 'lightgreen', 'gray', 'cyan')
    cmap = ListedColormap(colors[:len(np.unique(y))])

    # 绘图
    x1_min, x1_max = X[:, 0].min() - 1, X[:, 0].max() + 1
    x2_min, x2_max = X[:, 1].min() - 1, X[:, 1].max() + 1
    xx1, xx2 = np.meshgrid(np.arange(x1_min, x1_max, resolution),
                           np.arange(x2_min, x2_max, resolution))
    lab = classifier.predict(np.array([xx1.ravel(), xx2.ravel()]).T)
    lab = lab.reshape(xx1.shape)
    plt.contourf(xx1, xx2, lab, alpha=0.3, cmap=cmap)
    plt.xlim(xx1.min(), xx1.max())
    plt.ylim(xx2.min(), xx2.max())

    # 图加上分类样本
    for idx, cl in enumerate(np.unique(y)):
        plt.scatter(x=X[y == cl, 0],
                    y=X[y == cl, 1],
                    alpha=0.8,
                    c=colors[idx],
                    marker=markers[idx],
                    label=f'Class {cl}',
                    edgecolor='black')

    # 高亮显示测试数据集样本
    if test_idx:
        X_test, y_test = X[test_idx, :], y[test_idx]

        plt.scatter(X_test[:, 0],
                    X_test[:, 1],
                    c='none',
                    edgecolor='black',
                    alpha=1.0,
                    linewidth=1,
                    marker='o',
                    s=100,
                    label='Test set')
from sklearn import datasets
import numpy as np
####### 获取iris数据集 #######
iris = datasets.load_iris()
# 提取dataframe的第3列和第4列数据
X = iris.data[:, [2, 3]]
# 分类标签
y = iris.target

# 打印分类标签
print('Class labels:', np.unique(y))
# Class labels: [0 1 2]

####### 划分数据集 #######
from sklearn.model_selection import train_test_split
# X_train, y_train为训练集数据和标签
# X_test, y_test为测试集数据和标签
X_train, X_test, y_train, y_test = train_test_split(
    X, y, test_size=0.3, random_state=1, stratify=y)

# 打印各标签的数据包含的数据数量
print('Labels counts in y:', np.bincount(y))
print('Labels counts in y_train:', np.bincount(y_train))
print('Labels counts in y_test:', np.bincount(y_test))
# Labels counts in y: [50 50 50]
# Labels counts in y_train: [35 35 35]
# Labels counts in y_test: [15 15 15]

####### 标准化 #######
from sklearn.preprocessing import StandardScaler
sc = StandardScaler()
sc.fit(X_train)
# 标准化训练数据X_train_std , X_test_std
X_train_std = sc.transform(X_train)
X_test_std = sc.transform(X_test)


####### 获取模型训练数据集 #######
X_train_01_subset = X_train_std[(y_train == 0) | (y_train == 1)]
y_train_01_subset = y_train[(y_train == 0) | (y_train == 1)]

# 初始化类,定义学习率和批次规模参数
lrgd = LogisticRegressionGD(eta=0.3, n_iter=1000, random_state=1)
lrgd.fit(X_train_01_subset,
         y_train_01_subset)

# 绘图
plot_decision_regions(X=X_train_01_subset,
                      y=y_train_01_subset,
                      classifier=lrgd)

plt.xlabel('Petal length [standardized]')
plt.ylabel('Petal width [standardized]')
plt.legend(loc='upper left')

plt.tight_layout()
plt.show()
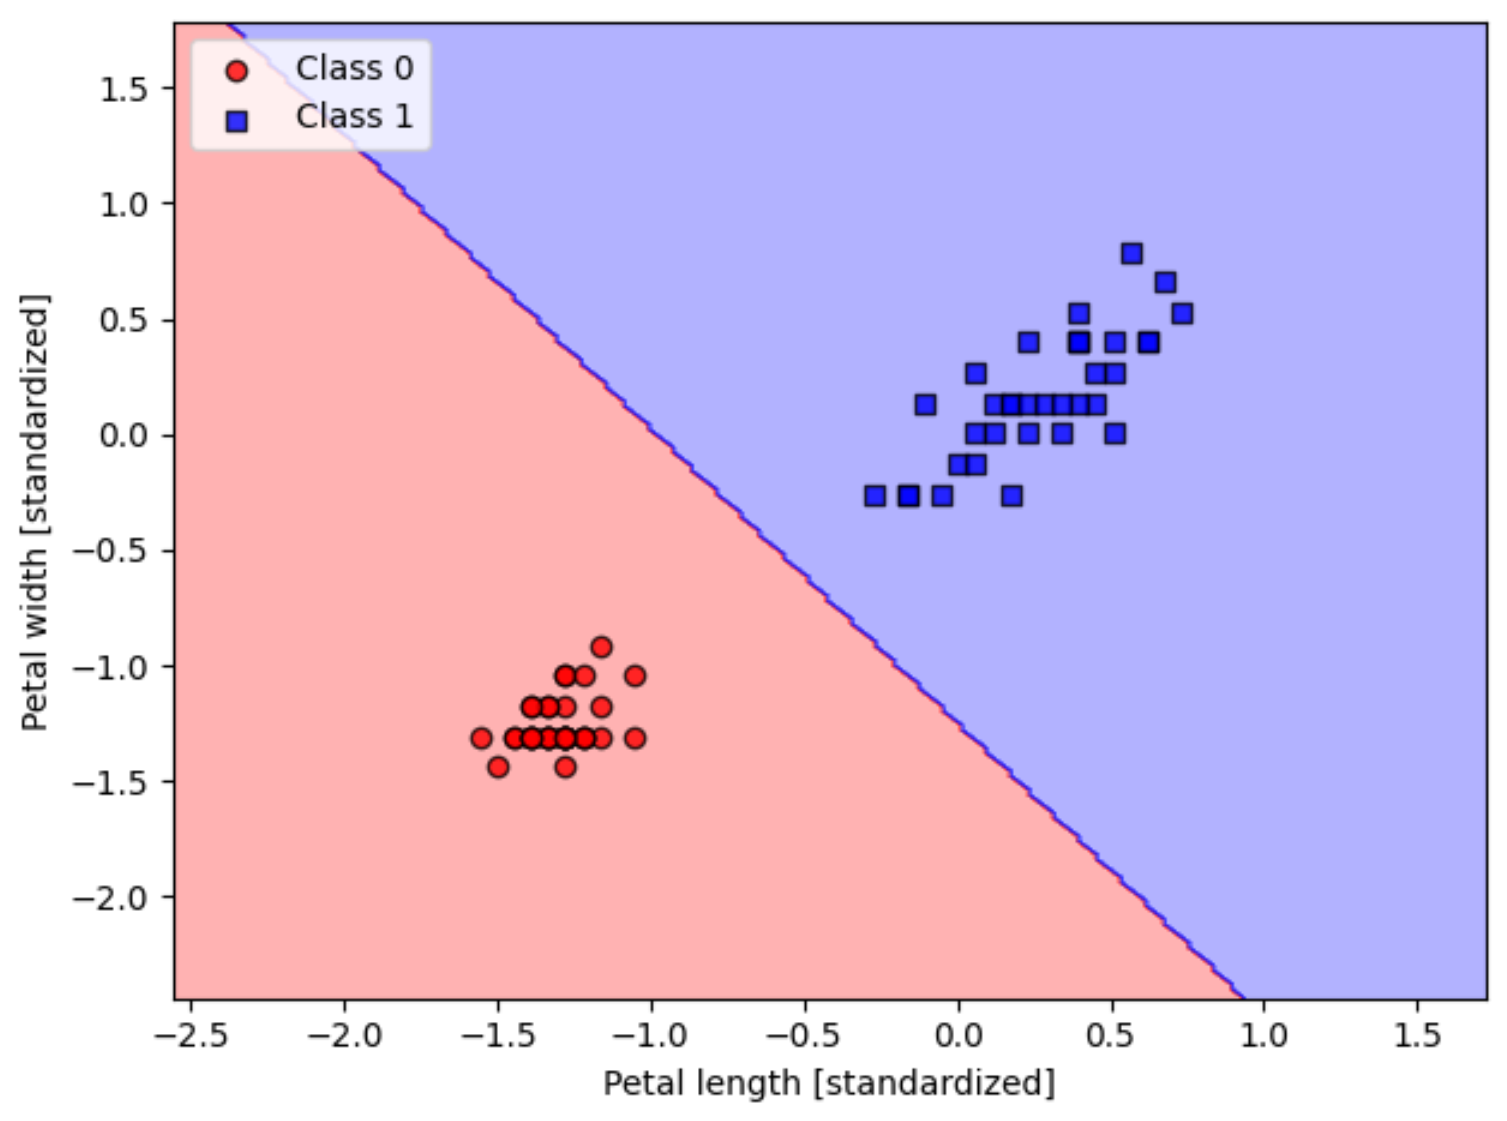
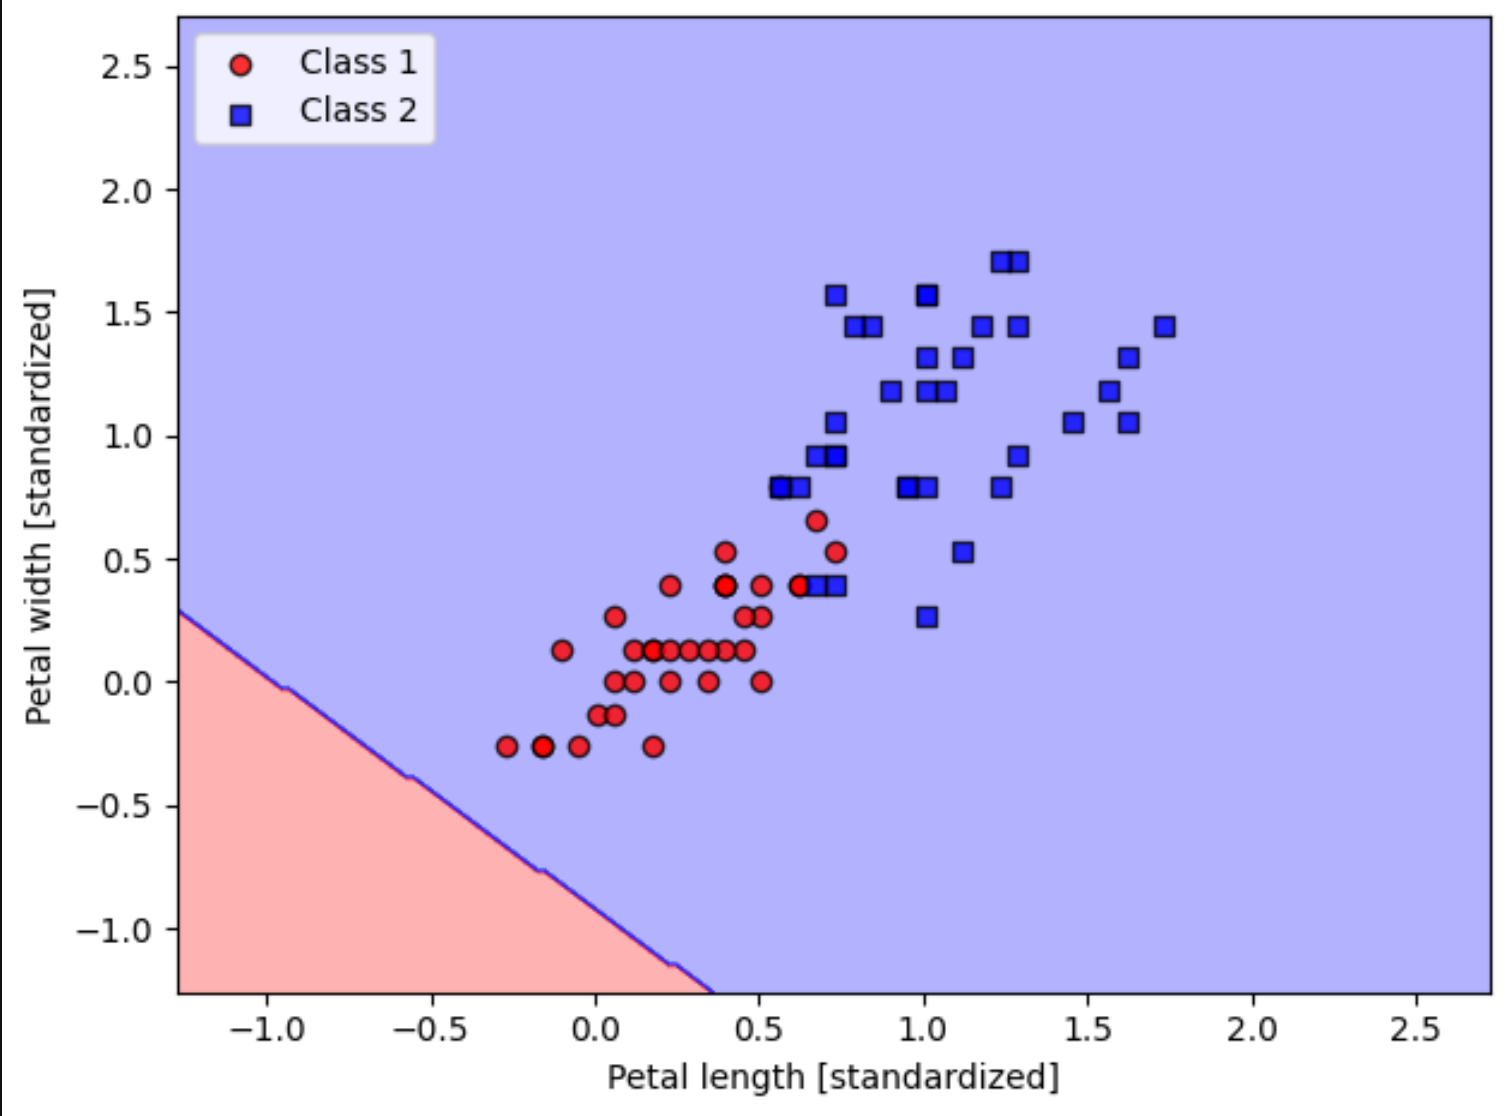
基于梯度下降算法的逻辑回归分类模型预测结果:
从下图结果可以看出,在训练数据集上,模型预测的样本标签Class0和Class1结果全部正确,但在区分表现Class1和Class2时很糟糕。
# 获取在测试数据集上模型的预测错误样本数量和预测精确度
# 将0和1替换为1和2,即可获取Class1和Class2预测结果
X_test_01_subset = X_test_std[(y_test == 0) | (y_test == 1)]
y_test_01_subset = y_test[(y_test== 0) | (y_test == 1)]

y_test_pred = lrgd.predict(X_test_01_subset)
print('Misclassified examples: %d' % (y_test_01_subset != y_test_pred).sum())
# Misclassified examples: 0

# 获取模型精确度
from sklearn.metrics import accuracy_score
print('Accuracy: %.3f' % accuracy_score(y_test_01_subset, y_test_pred))
# Accuracy: 1.000
3. 使用 scikit-learn训练逻辑回归模型
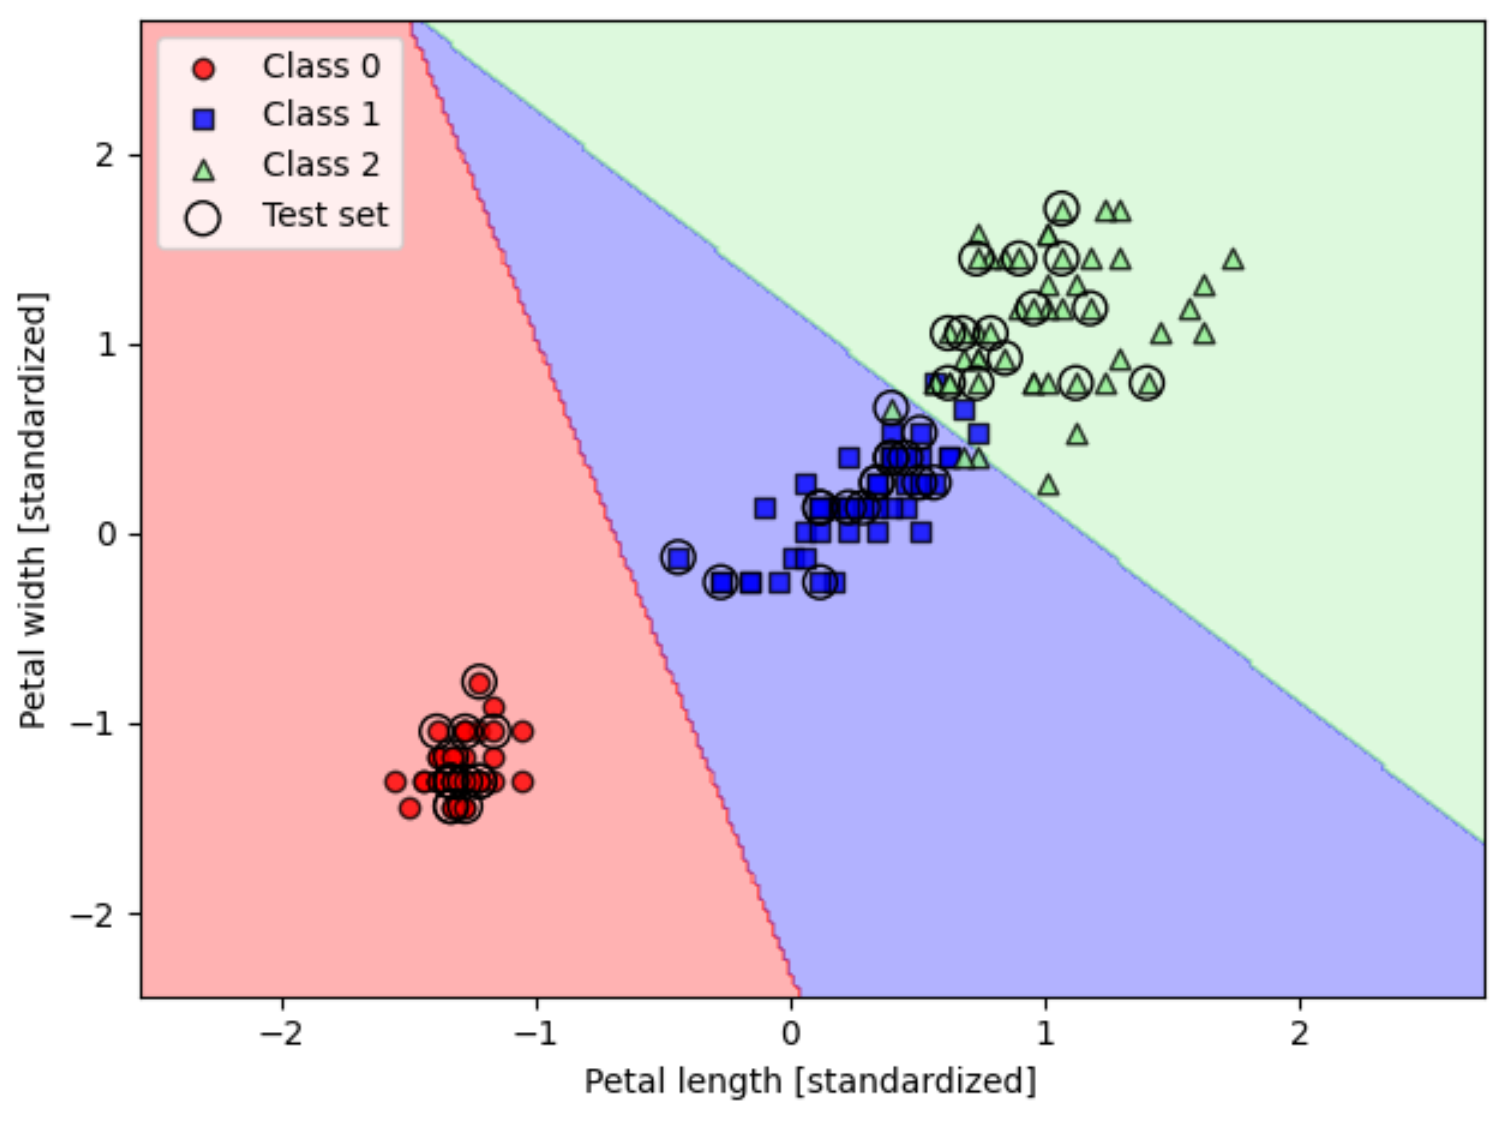
进一步使用scikit-learn训练逻辑回归模型,用于区分iris数据集的三个分类标签,该模型需有更高的预测精确度。
from sklearn.linear_model import LogisticRegression

# LogisticRegression参数说明
# C=100.0:正则化强度的倒数,必须是一个正数。C被设置为100.0,这意味着正则化强度较弱,允许模型更复杂一些
# solver='lbfgs':指定用于优化的算法,lbfgs是一种拟牛顿方法,适用于小数据集。其他常用的求解器包括liblinear(适用于二分类或多分类问题,具有L1或L2正则化)和saga(适用于L2正则化,且可以用于高维数据)
# multi_class='ovr':指定如果目标变量具有多于两个类别时使用的算法。ovr代表“一对一”(One-vs-Rest),也称为多类别逻辑回归。在这种设置中,对于每个类别,模型会学习一个将其与其余类别区分开的二元分类器。

# LogisticRegression类创建lr实例
lr = LogisticRegression(C=100.0, solver='lbfgs', multi_class='ovr')
lr.fit(X_train_std, y_train)

# 绘图
plot_decision_regions(X_combined_std, y_combined,
                      classifier=lr, test_idx=range(105, 150))

plt.xlabel('Petal length [standardized]')
plt.ylabel('Petal width [standardized]')
plt.legend(loc='upper left')
plt.tight_layout()
plt.show()

# 获取预测数据集中每个样本属于每个类别的概率
lr.predict_proba(X_test_std[:, :])
# array([[6.63770505e-09, 1.44747233e-01, 8.55252760e-01],
#       [8.34031210e-01, 1.65968790e-01, 3.20815954e-13],
#       [8.48822884e-01, 1.51177116e-01, 2.57998350e-14],

# 使用argmax函数输出每个样本概率最高类别的索引
lr.predict_proba(X_test_std[:, :]).argmax(axis=1)
# array([2, 0, 0, 1, 1, 1, 2, 1, 2, 0, 0, 2, 0, 1, 0, 1, 2, 1, 1, 2, 2, 0,
#       1, 2, 1, 1, 1, 2, 0, 2, 0, 0, 1, 1, 2, 2, 0, 0, 0, 1, 2, 2, 1, 0,
#       0])

# 输出测试数据集全部样本预测结果
lr.predict(X_test_std[:, :])
通过scikit-learn训练的回归模型,在预测标签1和2时,有少数样本分类错误,但预测精确度明显较高。
4. 通过正则化处理过拟合
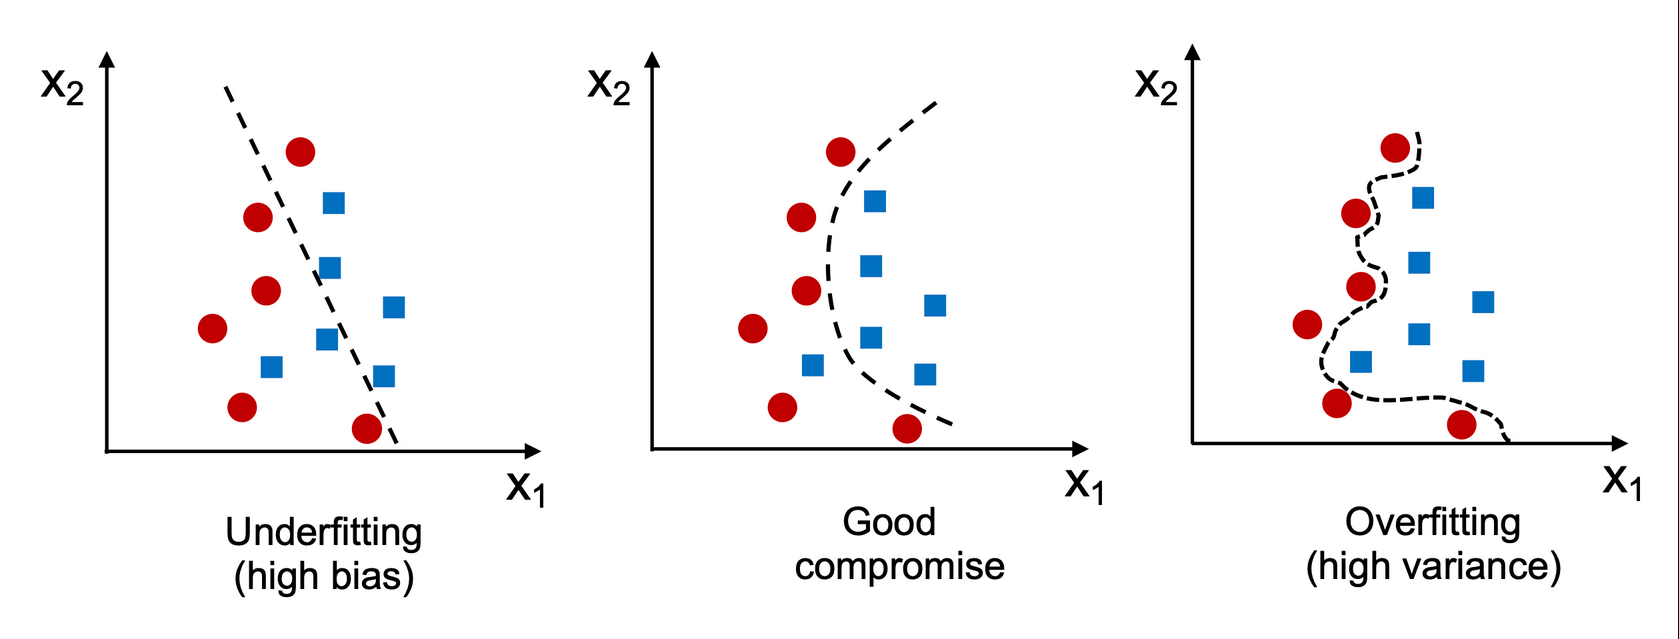
正则化 (regularization): 对模型复杂度的惩罚,正则化有助于防止模型出现过拟合。
欠拟合(underfitting): 欠拟合是指模型不能在训练集上获得足够低的误差。换句换说,就是模型复杂度低,模型在训练集上就表现很差,没法学习到数据背后的规律。
过拟合 (overfitting): 创建的模型与训练数据拟合程度过高,以致于模型无法根据未曾见过的新数据做出正确的预测。
欠拟合、拟合良好和过拟合示意图:
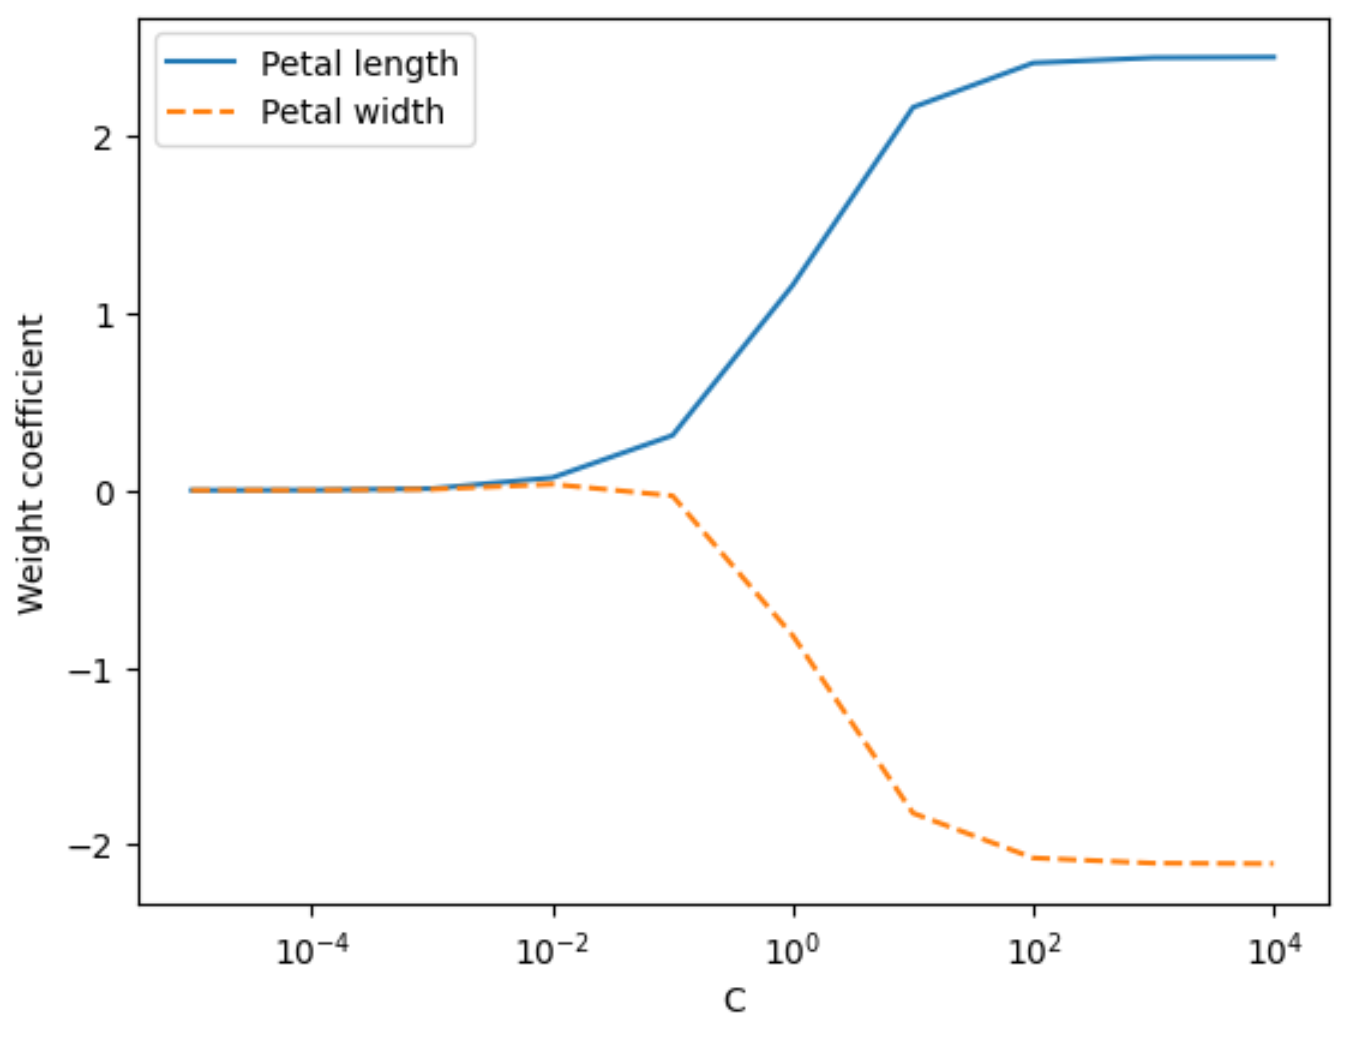
 特征权重随C值变化图
# weights是用于存储权重系数的列表
# C是正则化项的倒数,用于控制正则化的强度,params是用于存储C值的列表
weights, params = [], []

# 遍历数组-5到5之间数字(不包含5)
for c in np.arange(-5, 5):
    # C的值在每次迭代中以10的幂次方变化
    lr = LogisticRegression(C=10.**c,
                            multi_class='ovr')

    # 使用标准化后的训练数据X_train_std和训练标签y_train来拟合模型
    lr.fit(X_train_std, y_train)

    #将模型的第二个类别的权重系数(lr.coef_[1])添加到weights列表中
    weights.append(lr.coef_[1])
    params.append(10.**c)

# 列表转numpy数组
weights = np.array(weights)

# 绘制权重系数随C值变化的图
# weights[:, 0]和weights[:, 1]分别表示与花瓣长度和花瓣宽度相关的权重系数
plt.plot(params, weights[:, 0],
         label='Petal length')
plt.plot(params, weights[:, 1], linestyle='--',
         label='Petal width')

plt.ylabel('Weight coefficient')
plt.xlabel('C')
plt.legend(loc='upper left')
plt.xscale('log')
plt.show()
5. 支持向量机实现分类模型
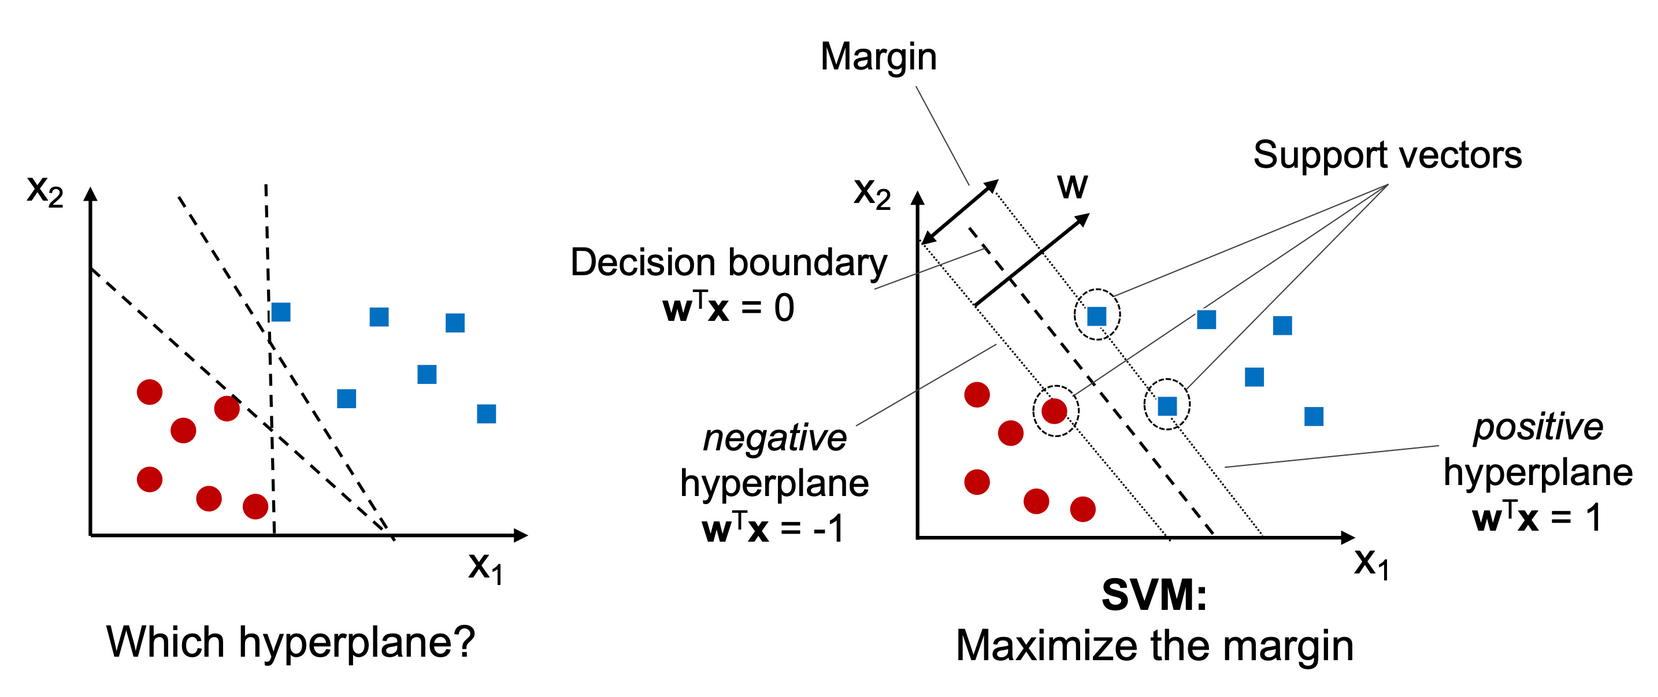
支持向量机(support vector machines,SVM)是一种二分类模型,它的目的是寻找一个超平面来对样本进行分割,分割的原则是间隔最大化,最终转化为一个凸二次规划问题来求解。由简单到复杂的模型包括:
当训练样本线性可分时,通过硬间隔最大化,学习一个线性可分支持向量机;
当训练样本近似线性可分时,通过软间隔最大化,学习一个线性支持向量机;
当训练样本线性不可分时,通过核技巧和软间隔最大化,学习一个非线性支持向量机。
SVM分类原理图:
Scikit-learn 中的替代实现方法
from sklearn.linear_model import SGDClassifier

# SGDClassifier类创建神经网络感知器实例
ppn = SGDClassifier(loss='perceptron')

# SGDClassifier类创建逻辑回归分类器实例
lr = SGDClassifier(loss='log')

# SGDClassifier类创建支持向量机分类器实例
svm = SGDClassifier(loss='hinge')
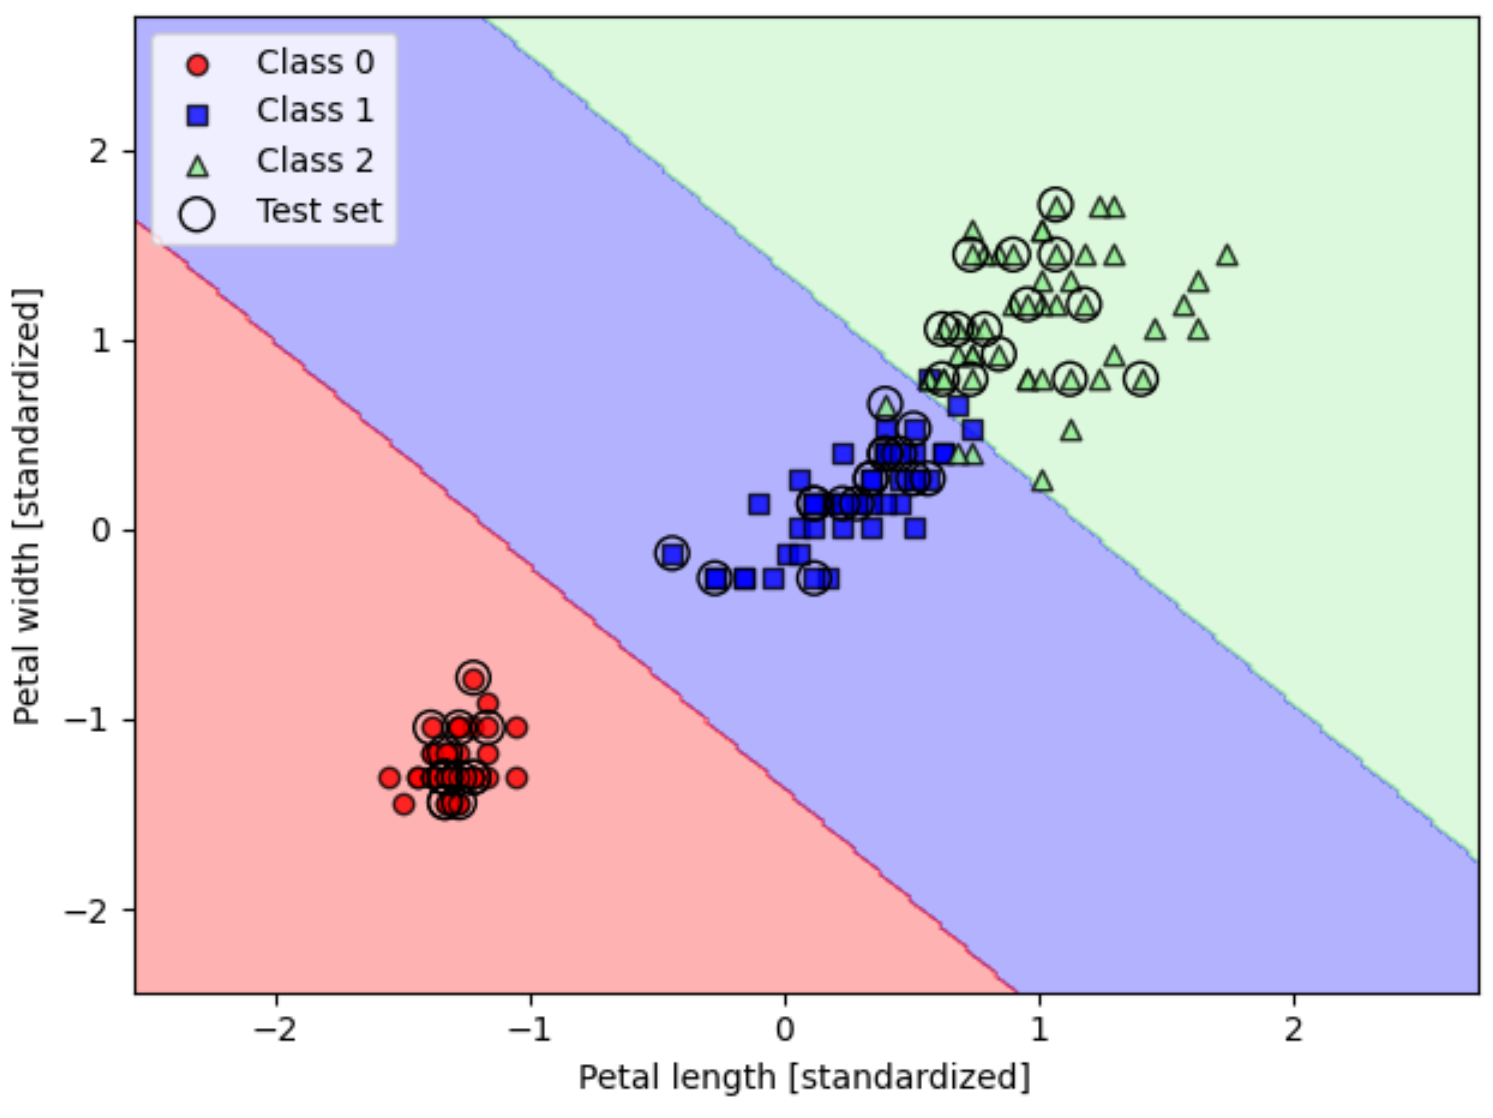
5.1 训练支持向量机分类模型
from sklearn.svm import SVC

# kernel='linear' 作为核函数
# C=1.0 设置了正则化参数,它控制了误差项和模型复杂度之间的权衡
svm = SVC(kernel='linear', C=1.0, random_state=1)
svm.fit(X_train_std, y_train)

plot_decision_regions(X_combined_std,
                      y_combined,
                      classifier=svm,
                      test_idx=range(105, 150))

plt.xlabel('Petal length [standardized]')
plt.ylabel('Petal width [standardized]')
plt.legend(loc='upper left')
plt.tight_layout()
plt.show()
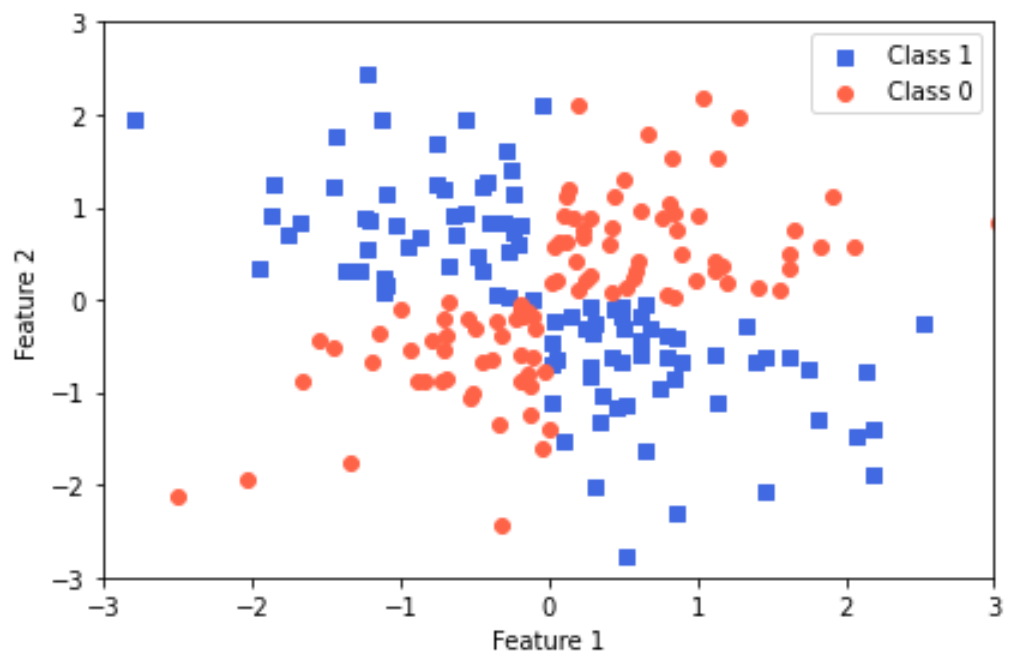
5.2 基于核支持向量机的非线性问题求解
import matplotlib.pyplot as plt
import numpy as np

# numpy随机种子
np.random.seed(1)
# 生成一个形状为 (200, 2) 的数组,其中包含从标准正态分布(均值为0,标准差为1)中抽取的200个样本,每个样本有两个特征
X_xor = np.random.randn(200, 2)

# 对每个样本,检查第一个特征是否大于0,然后检查第二个特征是否大于0。np.logical_xor 函数计算这两个条件的逻辑异或;
# 如果两个条件不同时为真(即一个为真,一个为假),则结果为 True,否则为 False。
y_xor = np.logical_xor(X_xor[:, 0] > 0,
                       X_xor[:, 1] > 0)

# 将逻辑值 True 和 False 转换为整数 1 和 0
y_xor = np.where(y_xor, 1, 0)

# X_xor[y_xor == 1, 0] 选择了 y_xor = 1 的样本的第一个特征(即第一个维度)
# X_xor[y_xor == 1, 1] 选择了 y_xor = 1 的样本的第二个特征(即第二个维度)
plt.scatter(X_xor[y_xor == 1, 0],
            X_xor[y_xor == 1, 1],
            c='royalblue',
            marker='s',
            label='Class 1')

# X_xor[y_xor == 0, 0] 选择了 y_xor = 0 的样本的第一个特征(即第一个维度)
# X_xor[y_xor == 0, 1] 选择了 y_xor = 0 的样本的第二个特征(即第二个维度)
plt.scatter(X_xor[y_xor == 0, 0],
            X_xor[y_xor == 0, 1],
            c='tomato',
            marker='o',
            label='Class 0')

plt.xlim([-3, 3])
plt.ylim([-3, 3])
plt.xlabel('Feature 1')
plt.ylabel('Feature 2')

plt.legend(loc='best')
plt.tight_layout()
plt.show()
 超平面(hpyerplane) 生成示意图:
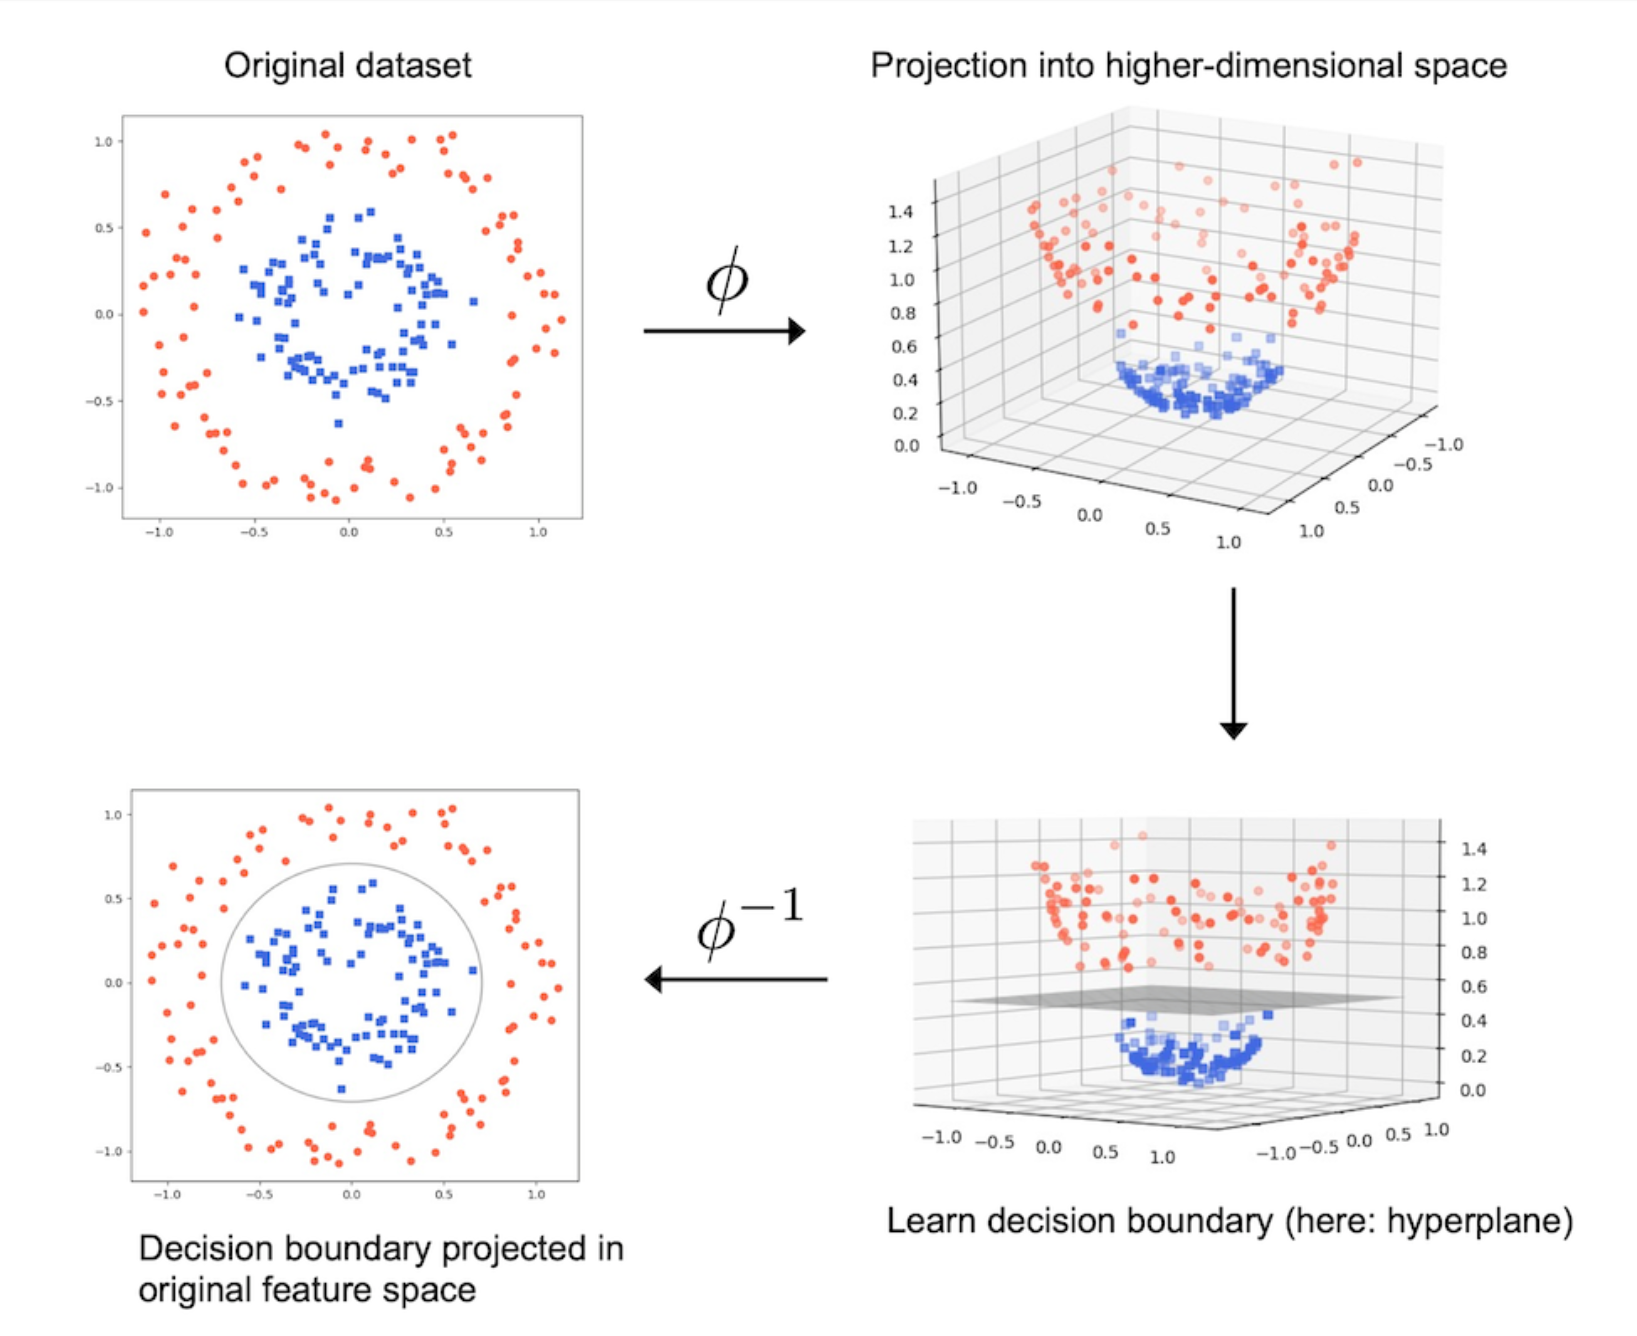
5.3 使用核方法( kernel trick)获取高维空间中的分离超平面
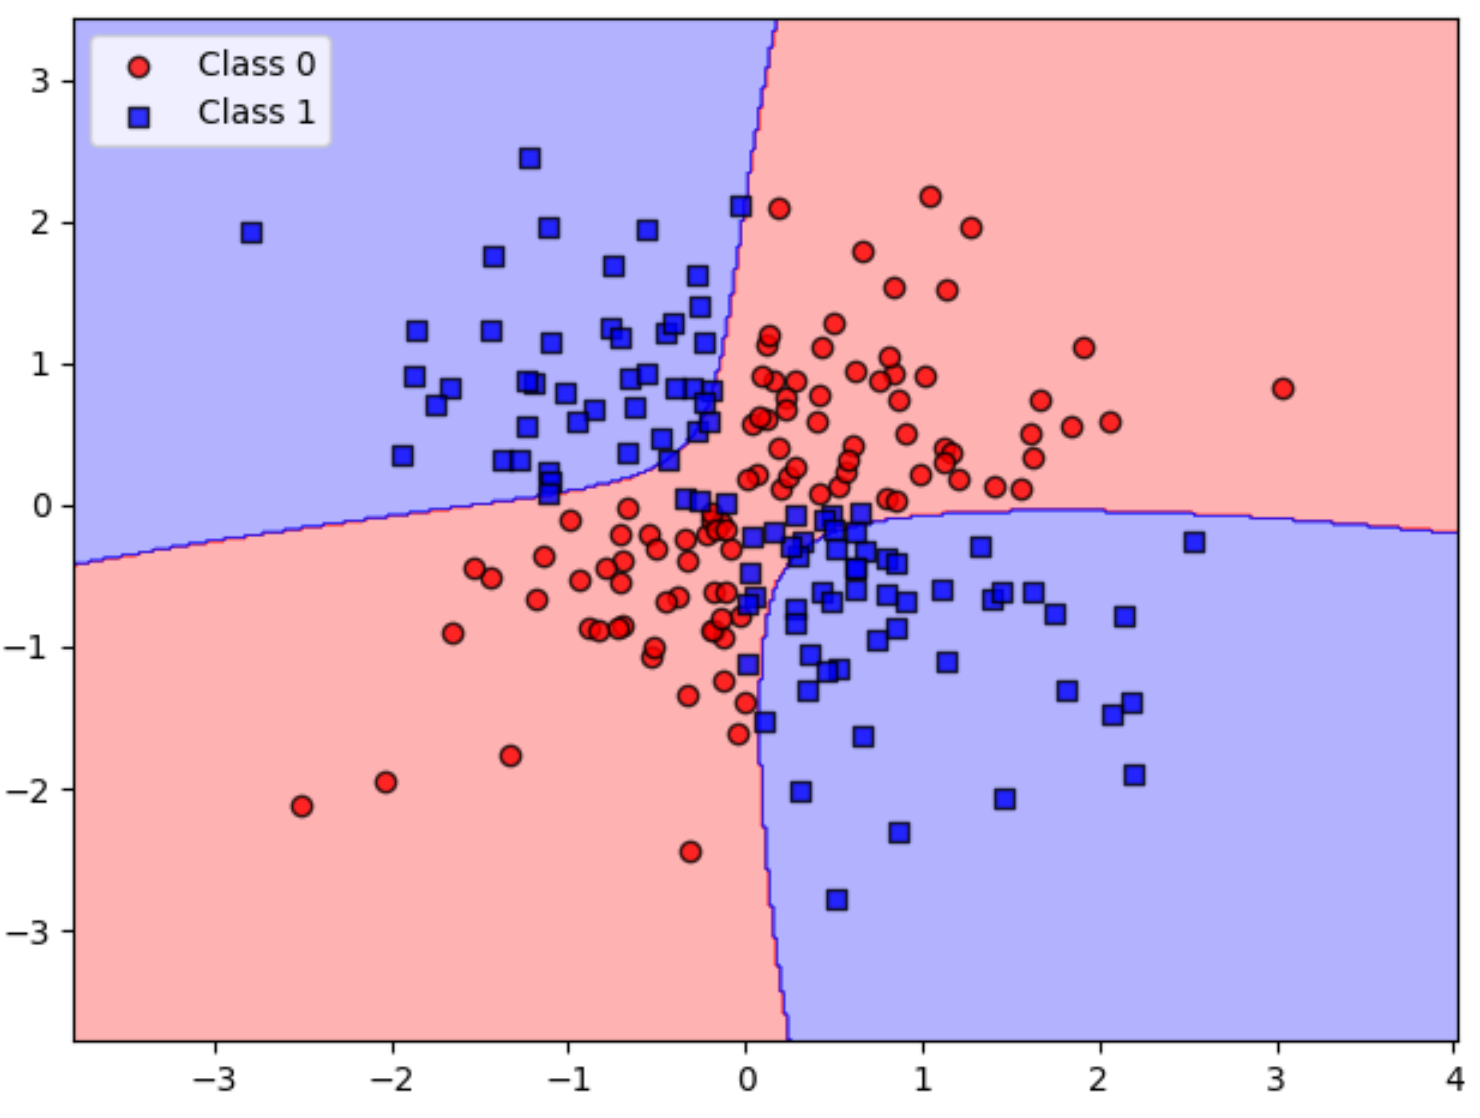
# kernel='rbf' 指定了径向基函数(Radial Basis Function)作为核函数;RBF 核能够处理非线性问题,通过将数据映射到高维空间来找到合适的决策边界。
# random_state=1 设置随机数生成器的种子,确保结果的可复现性。
# gamma=0.10 设置了 RBF 核的参数,它定义了单个训练样本的影响范围。
# C=10.0 设置了正则化参数,它控制了误差项和模型复杂度之间的权衡。
svm = SVC(kernel='rbf', random_state=1, gamma=0.10, C=10.0)
svm.fit(X_xor, y_xor)

# 绘制决策边界
plot_decision_regions(X_xor, y_xor,
                      classifier=svm)

plt.legend(loc='upper left')
plt.tight_layout()

plt.show()
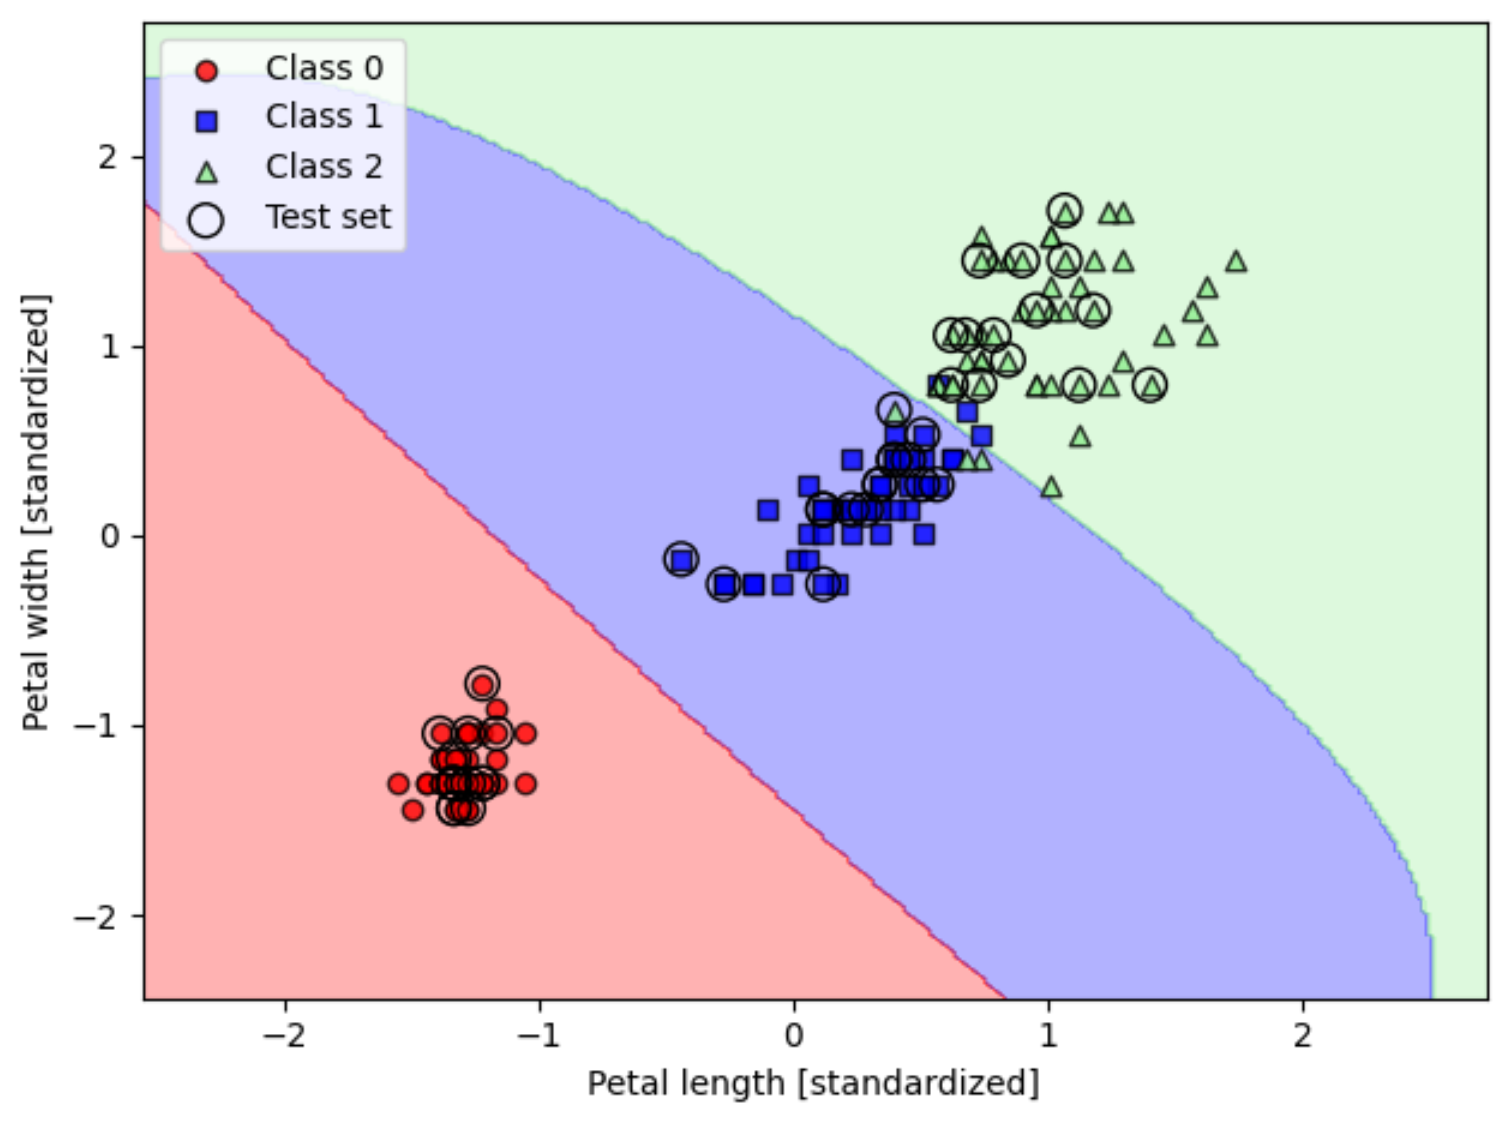
 运用到全部标签的分类预测:
from sklearn.svm import SVC

# 调整gamma=0.2和C=1
svm = SVC(kernel='rbf', random_state=1, gamma=0.2, C=1.0)
svm.fit(X_train_std, y_train)

# 绘图
plot_decision_regions(X_combined_std, y_combined,
                      classifier=svm, test_idx=range(105, 150))

plt.xlabel('Petal length [standardized]')
plt.ylabel('Petal width [standardized]')
plt.legend(loc='upper left')
plt.tight_layout()
plt.show()
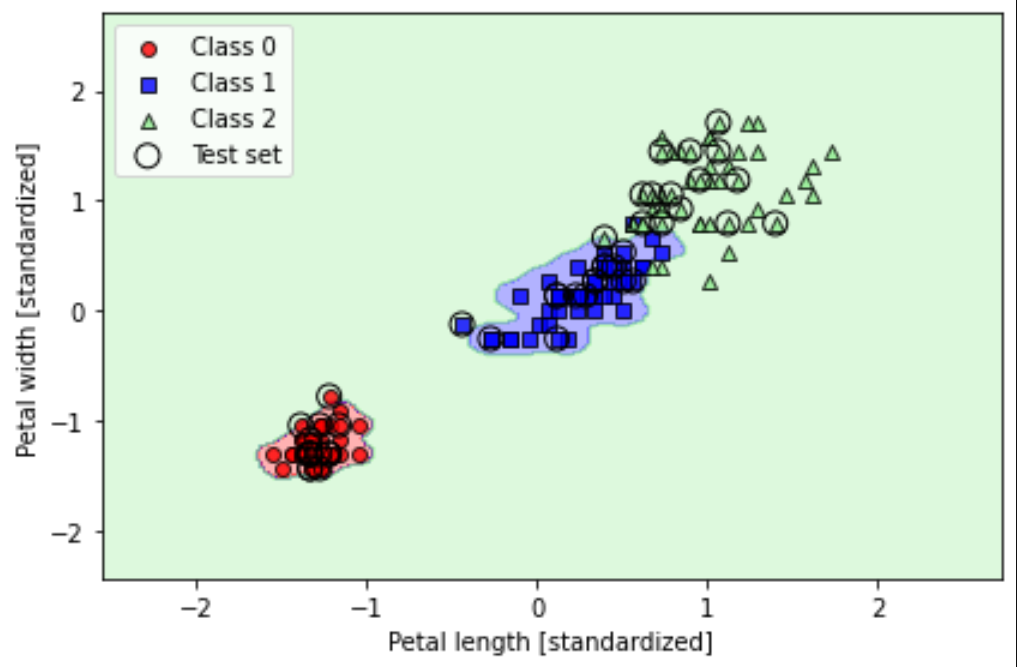
# 调整gamma=100和C=1
svm = SVC(kernel='rbf', random_state=1, gamma=100.0, C=1.0)
svm.fit(X_train_std, y_train)

plot_decision_regions(X_combined_std, y_combined,
                      classifier=svm, test_idx=range(105, 150))

plt.xlabel('Petal length [standardized]')
plt.ylabel('Petal width [standardized]')
plt.legend(loc='upper left')
plt.tight_layout()

plt.show()
机器学习文章
机器学习基本概念
Scikit-Learn训练机器学习分类感知器