当你的材料之间有多个性状数据需要进行显著性分析时,这个代码会对你非常有帮助。
1 数据准备
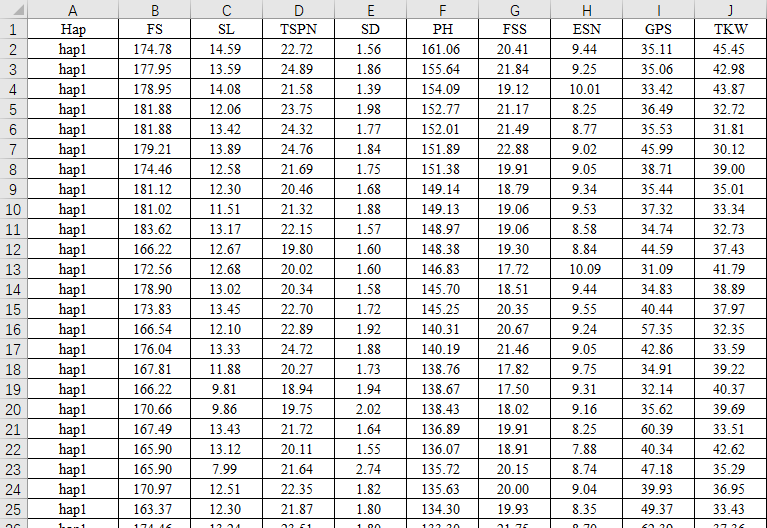
第一列为分组信息,表头一定要为“Hap”,分组数量不限,后面几列为你的性状数据。

2 作图代码
#载入R包
library(agricolae)
library(gridExtra)
library(ggplot2)

#读取文件,注意自行更改输入文件
md <- read.table("C:/Users/bfcui/Desktop/example.txt",header=T)

#将表头写入colnames
colnames=names(md)
plot_list = list()

#进行循环作图
for(i in 2:length(colnames)){
  real= colnames[i]
  #将作图数据写入data_i
  data_i <- md[,c(1,i)]
  data_i <- na.omit(data_i)
  #将数据表头改为"Hap trait"
  colnames(data_i)=c("Hap","trait")
  #计算多重比较
  mod = aov(data_i$trait ~ data_i$Hap, data=data_i)
  re = LSD.test(mod,"data_i$Hap",alpha = 0.05)
  mean<- re$means[,1]
  mar<- re$groups
  rownamemar <- row.names(mar)
  newmar<-data.frame(rownamemar,mar)
  sort<- newmar[order(newmar$rownamemar),]
  pop<-sort$rownamemar
  marker<-sort$groups
  sd<-re$means[,2]
  plotdata<-data.frame(pop,marker,mean,sd)
  #开始作图(这边是用的小提琴图,大家可自行更改美化)
  pi <- ggplot(data_i,aes(x=Hap,y=trait))+
    geom_violin(aes(fill = Hap),position = position_dodge(width = 1), scale = 'width',
                alpha=0.8,width=0.8,show.legend = F)+
    theme(panel.grid = element_blank(),
          panel.background = element_rect(color = "black",fill = "transparent"),
          legend.title=element_blank(),
          axis.title.x=element_blank())+
    geom_boxplot(position = position_dodge(width = 1),
                 outlier.colour="black",
                 outlier.shape=16,outlier.size = 0.5, width = 0.2,
                 show.legend = FALSE,fill="lightgray")+
    geom_text(data=plotdata,aes(x=factor(pop),y=mean+sd*5,label=marker),hjust=0)+
    theme_classic()+
    ylab(real)+xlab("")
  plot_list[[i]] = pi
}
nrow_num = ceiling((length(colnames)-1)/4)
height_num = nrow_num*2

#保存为pdf,注意自行更改保存路径
pdf(file='C:/Users/bfcui/Desktop/1.pdf',width = 10) # width为画布的宽度
new_list=plot_list[2:length(colnames)]
grid.arrange(grobs = new_list, ncol = 3,nrow=nrow_num) #原始ncol为每行小提琴图的个数
dev.off()
3 结果解读
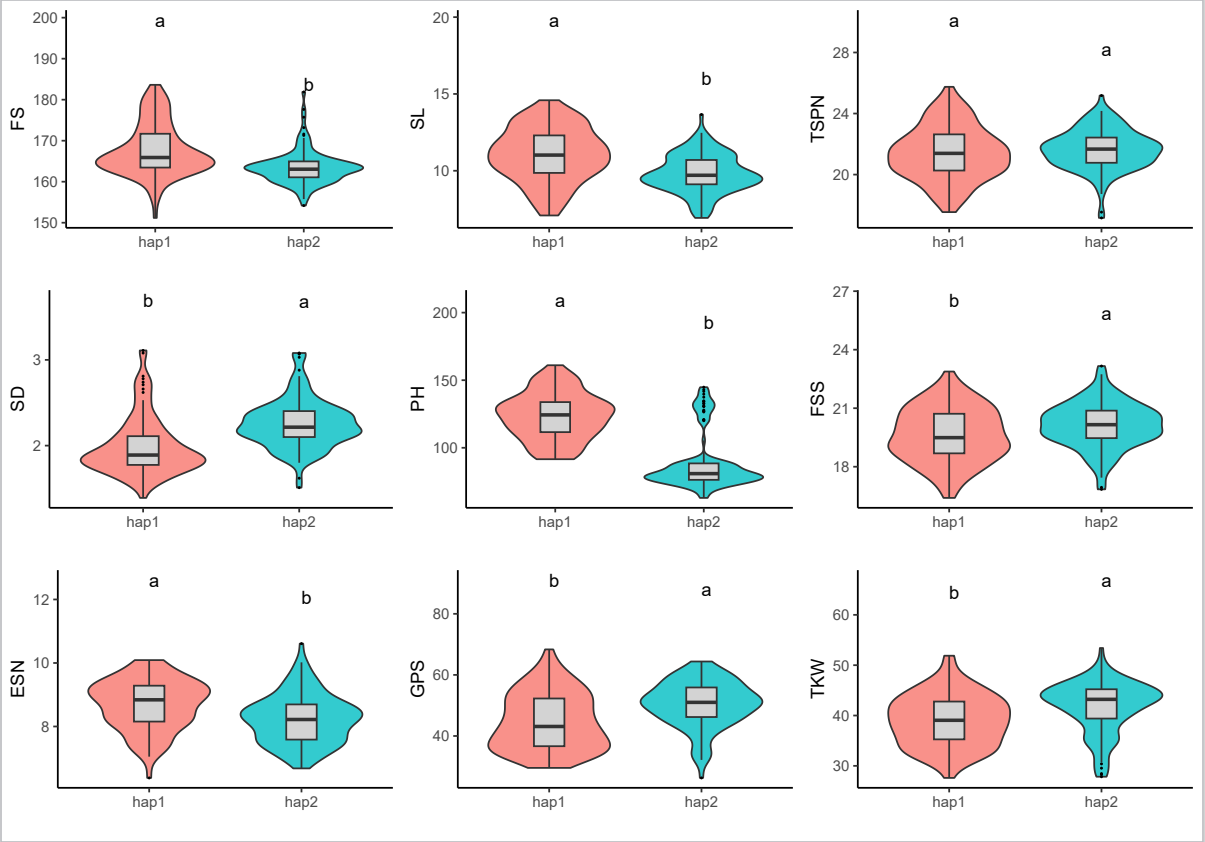
结果如下所示,纵坐标为为“性状名称”,横坐标为“分组信息”,小提琴图不同字母表示存在显著性差异。
