数据来源于论文
A multi-kingdom collection of 33,804 reference genomes for the human vaginal microbiome
https://www.nature.com/articles/s41564-024-01751-5
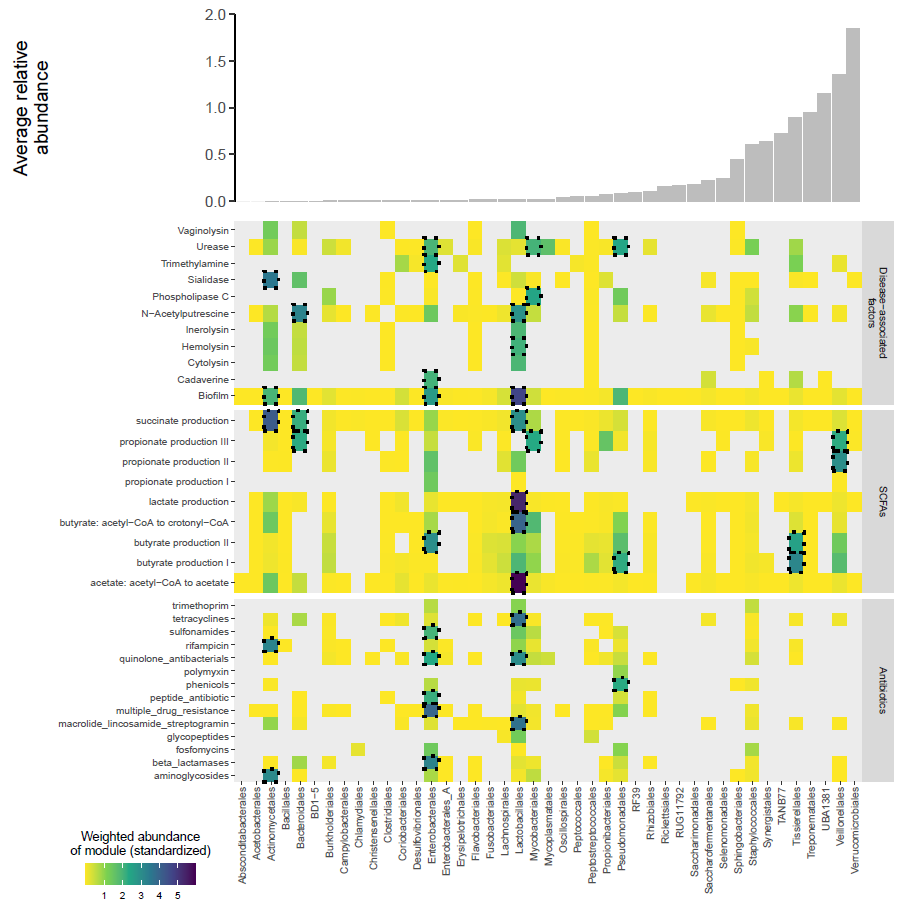
推文中复现图是论文中的figure 2e
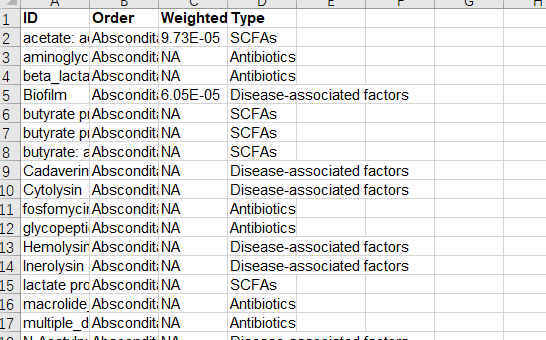
部分示例数据截图

作图代码
library(tidyverse)
library(readxl)
library(patchwork)

fig2e.dat<-read_excel("D:/R_4_1_0_working_directory/env001/2024.data/20240717/fig2e.xlsx",
                      na="NA")
fig2e.dat %>% colnames()
fig2e.dat

fig2e.dat %>%
  group_by(Order) %>%
  summarise(mean_value=mean(`Weighted abundance of module (standardized)`,na.rm = TRUE)) %>%
  ungroup() %>%
  arrange(mean_value) %>%
  mutate(Order=factor(Order,levels=Order))-> fig2e.bar.dat

fig2e.bar.dat %>%
  pull(Order) -> Order.level

ggplot(data = fig2e.bar.dat,aes(x=Order,y=mean_value))+
  geom_col(fill="#bdbdbd",color=NA)+
  theme_classic(base_size = 15)+
  theme(axis.text.x = element_blank(),
        axis.ticks.x = element_blank(),
        axis.line.x = element_blank())+
  labs(x=NULL,y="Average relative\nabundance")+
  scale_y_continuous(limits = c(0,2),
                     expand = expansion(mult = c(0,0))) -> fig2e.bar.plot

fig2e.bar.plot

Type.label<-c("Antibiotics\n","SCFAs\n","Disease-associated\nfactors")
names(Type.label)<-c("Antibiotics","SCFAs","Disease-associated factors")

fig2e.dat %>% pull(Type) %>%
  table()

fig2e.dat %>%
  mutate(Type=factor(Type,levels=c("Disease-associated factors",
                                   "SCFAs","Antibiotics"))) -> fig2e.dat

ggplot(data = fig2e.dat,aes(x=Order,y=ID))+
  geom_tile(aes(fill=`Weighted abundance of module (standardized)`))+
  theme_bw(base_size = 10)+
  theme(panel.border = element_blank(),
        panel.grid = element_blank(),
        axis.text.x = element_text(angle = 90,vjust = 0.5,hjust=1),
        strip.background = element_rect(color=NA),
        legend.position = c(-0.15,-0.15),
        legend.direction = "horizontal",
        legend.background = element_rect(fill=NA))+
  scale_fill_viridis_c(direction = -1,
                       name="Weighted abundance\nof module (standardized)",
                       na.value="#ececec")+
  labs(x=NULL,y=NULL)+
  facet_wrap(~Type,strip.position = "right",
             labeller = labeller(Type=Type.label),
             ncol = 1,
             scales = "free_y")+
  scale_y_discrete(expand = expansion(mult = c(0,0)))+
  scale_x_discrete(expand = expansion(mult = c(0,0)))+
  #coord_equal()+
  geom_tile(data = fig2e.dat %>%
              filter(`Weighted abundance of module (standardized)`>2),
            fill=NA,color="black",
            lty="dotted",
            linewidth=1)+
  guides(fill=guide_colorbar(title.position="top",
                             title.hjust=0.5))+
  coord_cartesian(clip = "off") -> fig2e.heatmap.plot

fig2e.heatmap.plot

fig2e.bar.plot+
  fig2e.heatmap.plot+
  plot_layout(ncol = 1,heights = c(1,3))

关于ggplot2的零散知识点
ggplot2分面作图不同类别的文本是strip
修改strip的文本用到的是
Type.label<-c("Antibiotics\n","SCFAs\n","Disease-associated\nfactors")
names(Type.label)<-c("Antibiotics","SCFAs","Disease-associated factors")

facet_wrap(~Type,strip.position = "right",
             labeller = labeller(Type=Type.label),
             ncol = 1,
             scales = "free_y")
欢迎大家关注我的公众号
小明的数据分析笔记本
小明的数据分析笔记本 公众号 主要分享:1、R语言和python做数据分析和数据可视化的简单小例子;2、园艺植物相关转录组学、基因组学、群体遗传学文献阅读笔记;3、生物信息学入门学习资料及自己的学习笔记!