基因结构变异位置图绘制方法

今天分享一个绘制基因结构和变异的R包“trackViewer”,该软件包已经在Nature Methods上发表,广受好评。

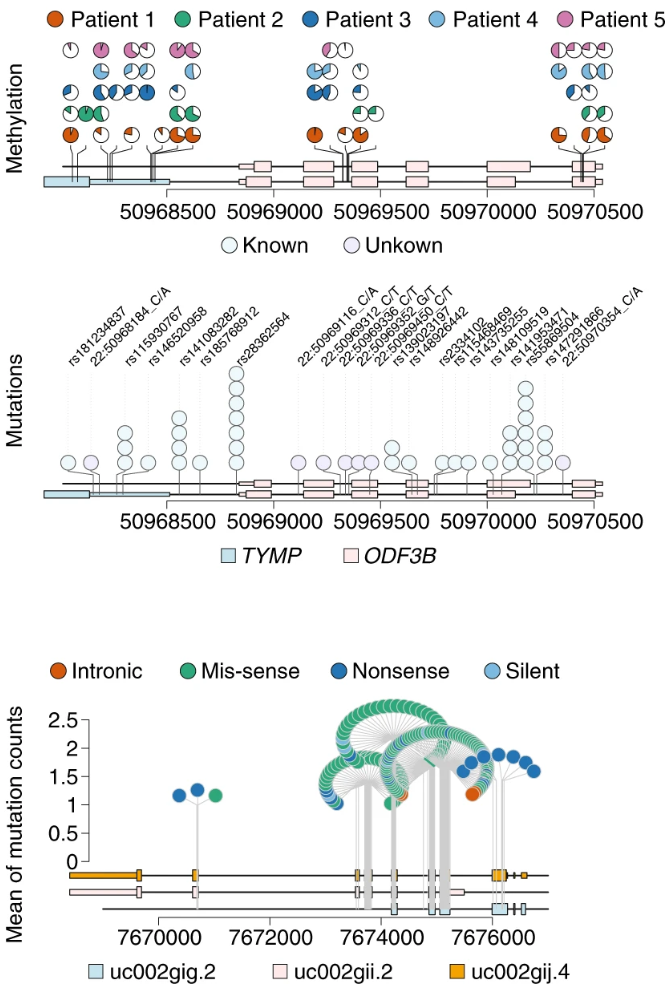
这个包的功能很强大,专门为多组学数据便捷可视化而设计,拥有多种类型的结果图,基于R语言即可实现高效分析制图。

Lolliplot 棒棒糖图 🍭
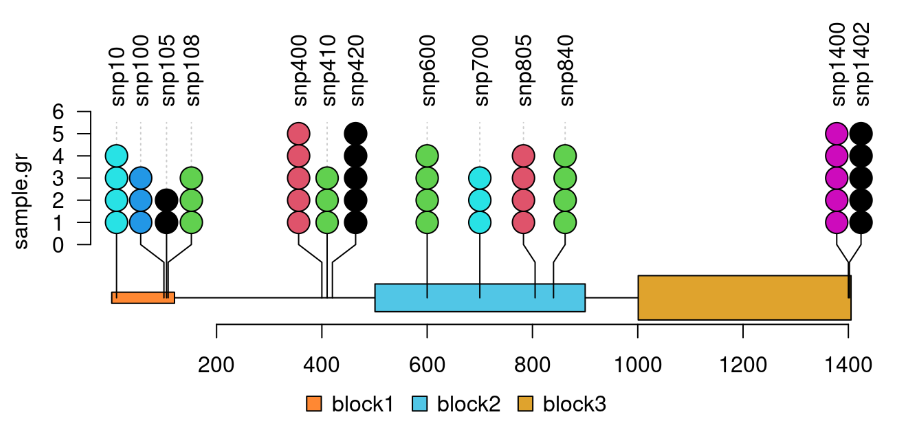
该包在bioconductor中,安装时使用BiocManger进行安装即可,速度可能比较慢,因为依赖包复杂。 lolliplot功能用于可视化甲基化/突变体/基因组突变位置等数据,需要的输入文件格式是基因的结果信息(图的下半部分)和变异位点SNP的位置信息(每个棒棒糖的坐标)。
library(trackViewer)
features <- GRanges("chr1", IRanges(c(1, 501, 1001),
                                    width=c(120, 400, 405),
                                    names=paste0("block", 1:3)),
                    fill = c("#FF8833", "#51C6E6", "#DFA32D"),
                    height = c(0.02, 0.05, 0.08))
SNP <- c(10, 100, 105, 108, 400, 410, 420, 600, 700, 805, 840, 1400, 1402)
sample.gr <- GRanges("chr1", IRanges(SNP, width=1, names=paste0("snp", SNP)),
                     color = sample.int(6, length(SNP), replace=TRUE),
                     score = sample.int(5, length(SNP), replace = TRUE))
lolliplot(sample.gr, features)

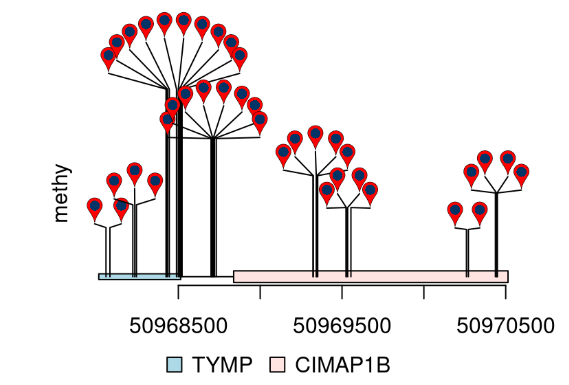
另外,除了棒棒图作者还提供了另外一种展示变异位点的方法,像一朵蒲公英一样,所以就暂时把它叫做蒲公英图吧。
Dandelion 蒲公英图 🌸
library(trackViewer)
library(TxDb.Hsapiens.UCSC.hg19.knownGene)
library(org.Hs.eg.db)
methy <- import(system.file("extdata", "methy.bed", package="trackViewer"), "BED")
gr <- GRanges("chr22", IRanges(50968014, 50970514, names="TYMP"))
trs <- geneModelFromTxdb(TxDb.Hsapiens.UCSC.hg19.knownGene,
                         org.Hs.eg.db,
                         gr=gr)
features <- c(range(trs[[1]]$dat), range(trs[[5]]$dat))
names(features) <- c(trs[[1]]$name, trs[[5]]$name)
features$fill <- c("lightblue", "mistyrose")
features$height <- c(.02, .04)
dandelion.plot(methy, features, ranges=gr, type="pin")

今天的分享就到这里,下次有空时专门写一篇笔记,详细介绍棒棒图进阶技巧,感谢您的观看
参考资料
https://bioconductor.org/packages/release/bioc/vignettes/trackViewer/inst/doc/lollipopPlot.html#Change_the_lolliplot_color
https://github.com/jianhong/trackViewer/tree/devel/R
https://www.nature.com/articles/s41592-019-0430-y
![]() 数据可视化
857 人阅读
|
0 人回复
|
2024-06-20
数据可视化
857 人阅读
|
0 人回复
|
2024-06-20