一边学习,一边总结,一边分享!
关于《R语言绘图专栏》
关于《R语言绘图专栏》,此专栏基于 R语言绘制图形。每个图形我们会提供对应的 R代码、数据和 文本文档。此系列将会是一个长期更新的系列。
注意:若是你加入我们社群,则直接在社群中获得。
本期教程

获得本教程 Data and Code,请在后台回复:20240816。
2022年教程总汇
 https://mp.weixin.qq.com/s/Lnl258WhbK2a8pRZFuIyVg
2023年教程总汇
 https://mp.weixin.qq.com/s/wCTswNP8iHMNvu5GQauHdg
Code
- 导入R包
# get the stable version from CRAN
install.packages("deeptime")

# or get the development version from github
# install.packages("devtools")
devtools::install_github("willgearty/deeptime")

##'@加载对应的R包
library(deeptime)
library(ggplot2)
library(dplyr)
- 导入数据
corals <- read.csv("20240816_input.data.csv",header = T,row.names = 1)
head(corals)
3.绘制简单 timescales图
ggplot(coral_div) +
  geom_line(aes(x = stage_age, y = n)) +
  scale_x_reverse("Age (Ma)") +
  ylab("Coral Genera") +
  coord_geo(xlim = c(250, 0), ylim = c(0, 1700)) +
  theme_classic(base_size = 16)

ggsave("01.jpg",width = 6, height = 4)

library(gsloid)

# Plot two different timescales
ggplot(lisiecki2005) +
  geom_line(aes(x = d18O, y = Time / 1000), orientation = "y") +
  scale_y_reverse("Time (Ma)") +
  scale_x_reverse("\u03B418O") +
  coord_geo(
    dat = list("Geomagnetic Polarity Chron",
               "Planktic foraminiferal Primary Biozones"),
    xlim = c(6, 2), ylim = c(5.5, 0), pos = list("l", "r"),
    rot = 90, skip = "PL4", size = list(5, 4)
  ) +
  theme_classic(base_size = 16)

ggsave("02.timescales.jpg",width = 6, height = 4)

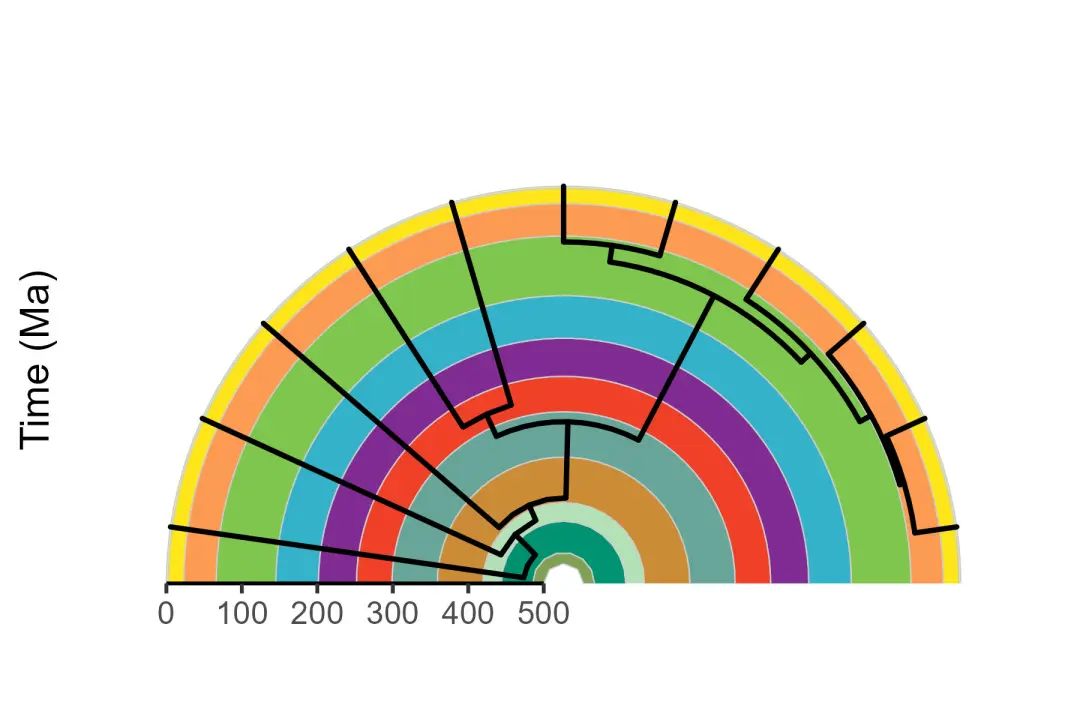
- 多种布局[phylogeny timescale]
```R
library(ggtree)
#install.packages("rphylopic")
library(rphylopic)

# Get vertebrate phylogeny
library(phytools)
data(vertebrate.tree)

vertebrate.tree$tip.label[vertebrate.tree$tip.label ==
                            "Myotis_lucifugus"] <- "Vespertilioninae"
vertebrate_data <- data.frame(species = vertebrate.tree$tip.label,
                              name = vertebrate.tree$tip.label)

# Plot the phylogeny with a timescale
revts(ggtree(vertebrate.tree, size = 1)) %<+%
  vertebrate_data +
  geom_phylopic(aes(name = name), size = 25) +
  scale_x_continuous("Time (Ma)", breaks = seq(-500, 0, 100),
                     labels = seq(500, 0, -100), limits = c(-500, 0),
                     expand = expansion(mult = 0)) +
  scale_y_continuous(guide = NULL) +
  coord_geo_radial(dat = "periods", end = 0.5 * pi) +
  theme_classic(base_size = 16)

ggsave("03.phylogeny_timecales.jpg",width = 6, height = 4)

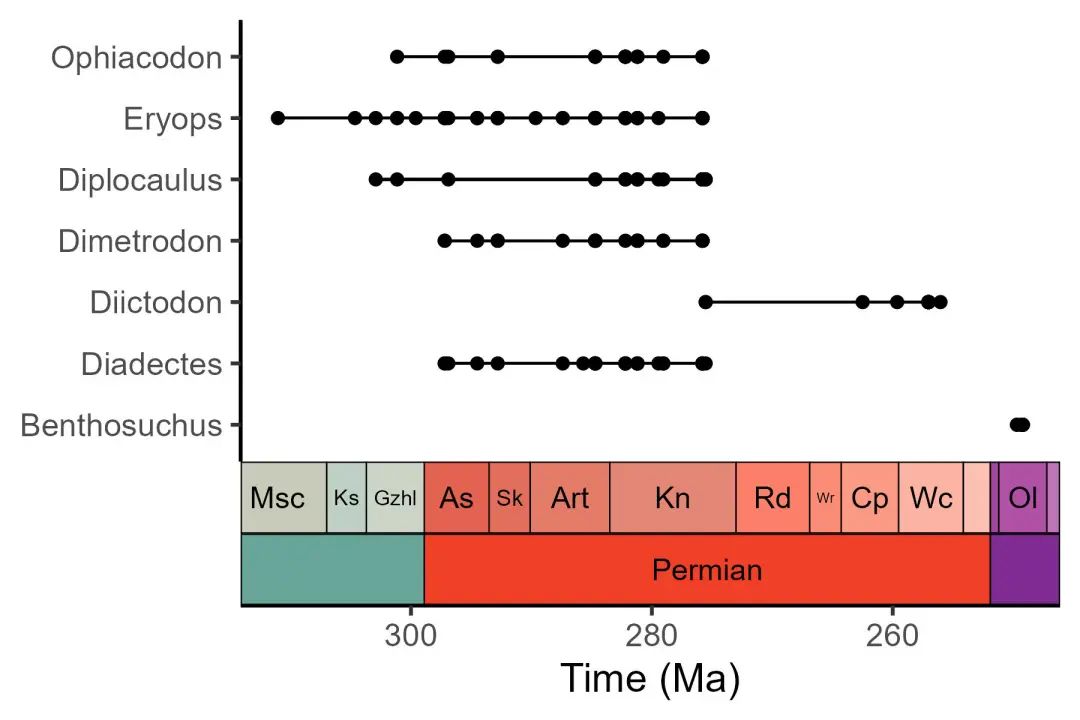
library(palaeoverse)

# Filter occurrences
occdf <- subset(tetrapods, accepted_rank == "genus")
occdf <- subset(occdf, accepted_name %in%
                  c("Eryops", "Dimetrodon", "Diadectes", "Diictodon",
                    "Ophiacodon", "Diplocaulus", "Benthosuchus"))

# Plot occurrences
ggplot(data = occdf) +
  geom_points_range(aes(x = (max_ma + min_ma)/2, y = accepted_name)) +
  scale_x_reverse(name = "Time (Ma)") +
  ylab(NULL) +
  coord_geo(pos = list("bottom", "bottom"), dat = list("stages", "periods"),
            abbrv = list(TRUE, FALSE), expand = TRUE, size = "auto") +
  theme_classic(base_size = 16)

ggsave("04.jpg",width = 6, height = 4)

- Use standardized geological patterns
library(rmacrostrat)
library(ggrepel)
library(geopattern)

# Retrieve the Macrostrat units in the San Juan Basin column
san_juan_units <- get_units(column_id = 489, interval_name = "Cretaceous")

# Specify x_min and x_max in dataframe
san_juan_units$x_min <- 0
san_juan_units$x_max <- 1
# Tweak values for overlapping units
san_juan_units$x_max[10] <- 0.5
san_juan_units$x_min[11] <- 0.5

# Add midpoint age for plotting
san_juan_units$m_age <- (san_juan_units$b_age + san_juan_units$t_age) / 2

# Get lithology definitions
liths <- def_lithologies()

# Get the primary lithology for each unit
san_juan_units$lith_prim <- sapply(san_juan_units$lith, function(df) {
  df$name[which.max(df$prop)]
})

# Get the pattern codes for those lithologies
san_juan_units$pattern <- factor(liths$fill[match(san_juan_units$lith_prim, liths$name)])

# Plot with pattern fills
ggplot(san_juan_units, aes(ymin = b_age, ymax = t_age,
                           xmin = x_min, xmax = x_max)) +
  # Plot units, patterned by rock type
  geom_rect(aes(fill = pattern), color = "black") +
  scale_fill_geopattern() +
  # Add text labels
  geom_text_repel(aes(x = x_max, y = m_age, label = unit_name),
                  size = 3.5, hjust = 0, force = 2,
                  min.segment.length = 0, direction = "y",
                  nudge_x = rep_len(x = c(2, 3), length.out = 17)) +
  # Reverse direction of y-axis
  scale_y_reverse(limits = c(145, 66), n.breaks = 10, name = "Time (Ma)") +
  # Theming
  theme_classic(base_size = 16) +
  theme(legend.position = "none",
        axis.line.x = element_blank(),
        axis.title.x = element_blank(),
        axis.text.x = element_blank(),
        axis.ticks.x = element_blank()) +
  # Add geological time scale
  coord_geo(pos = "left", dat = list("stages"), rot = 90)

获得本教程 Data and Code,请在后台回复:20240816。
若我们的教程对你有所帮助,请 点赞+收藏+转发,这是对我们最大的支持。
往期部分文章
1. 最全WGCNA教程(替换数据即可出全部结果与图形)
2. 精美图形绘制教程
3. 转录组分析教程
4. 转录组下游分析
小杜的生信筆記 ,主要发表或收录生物信息学教程,以及基于R分析和可视化(包括数据分析,图形绘制等);分享感兴趣的文献和学习资料!!