往期R语言数据分析文章:
R语言数据分析入门1-40问
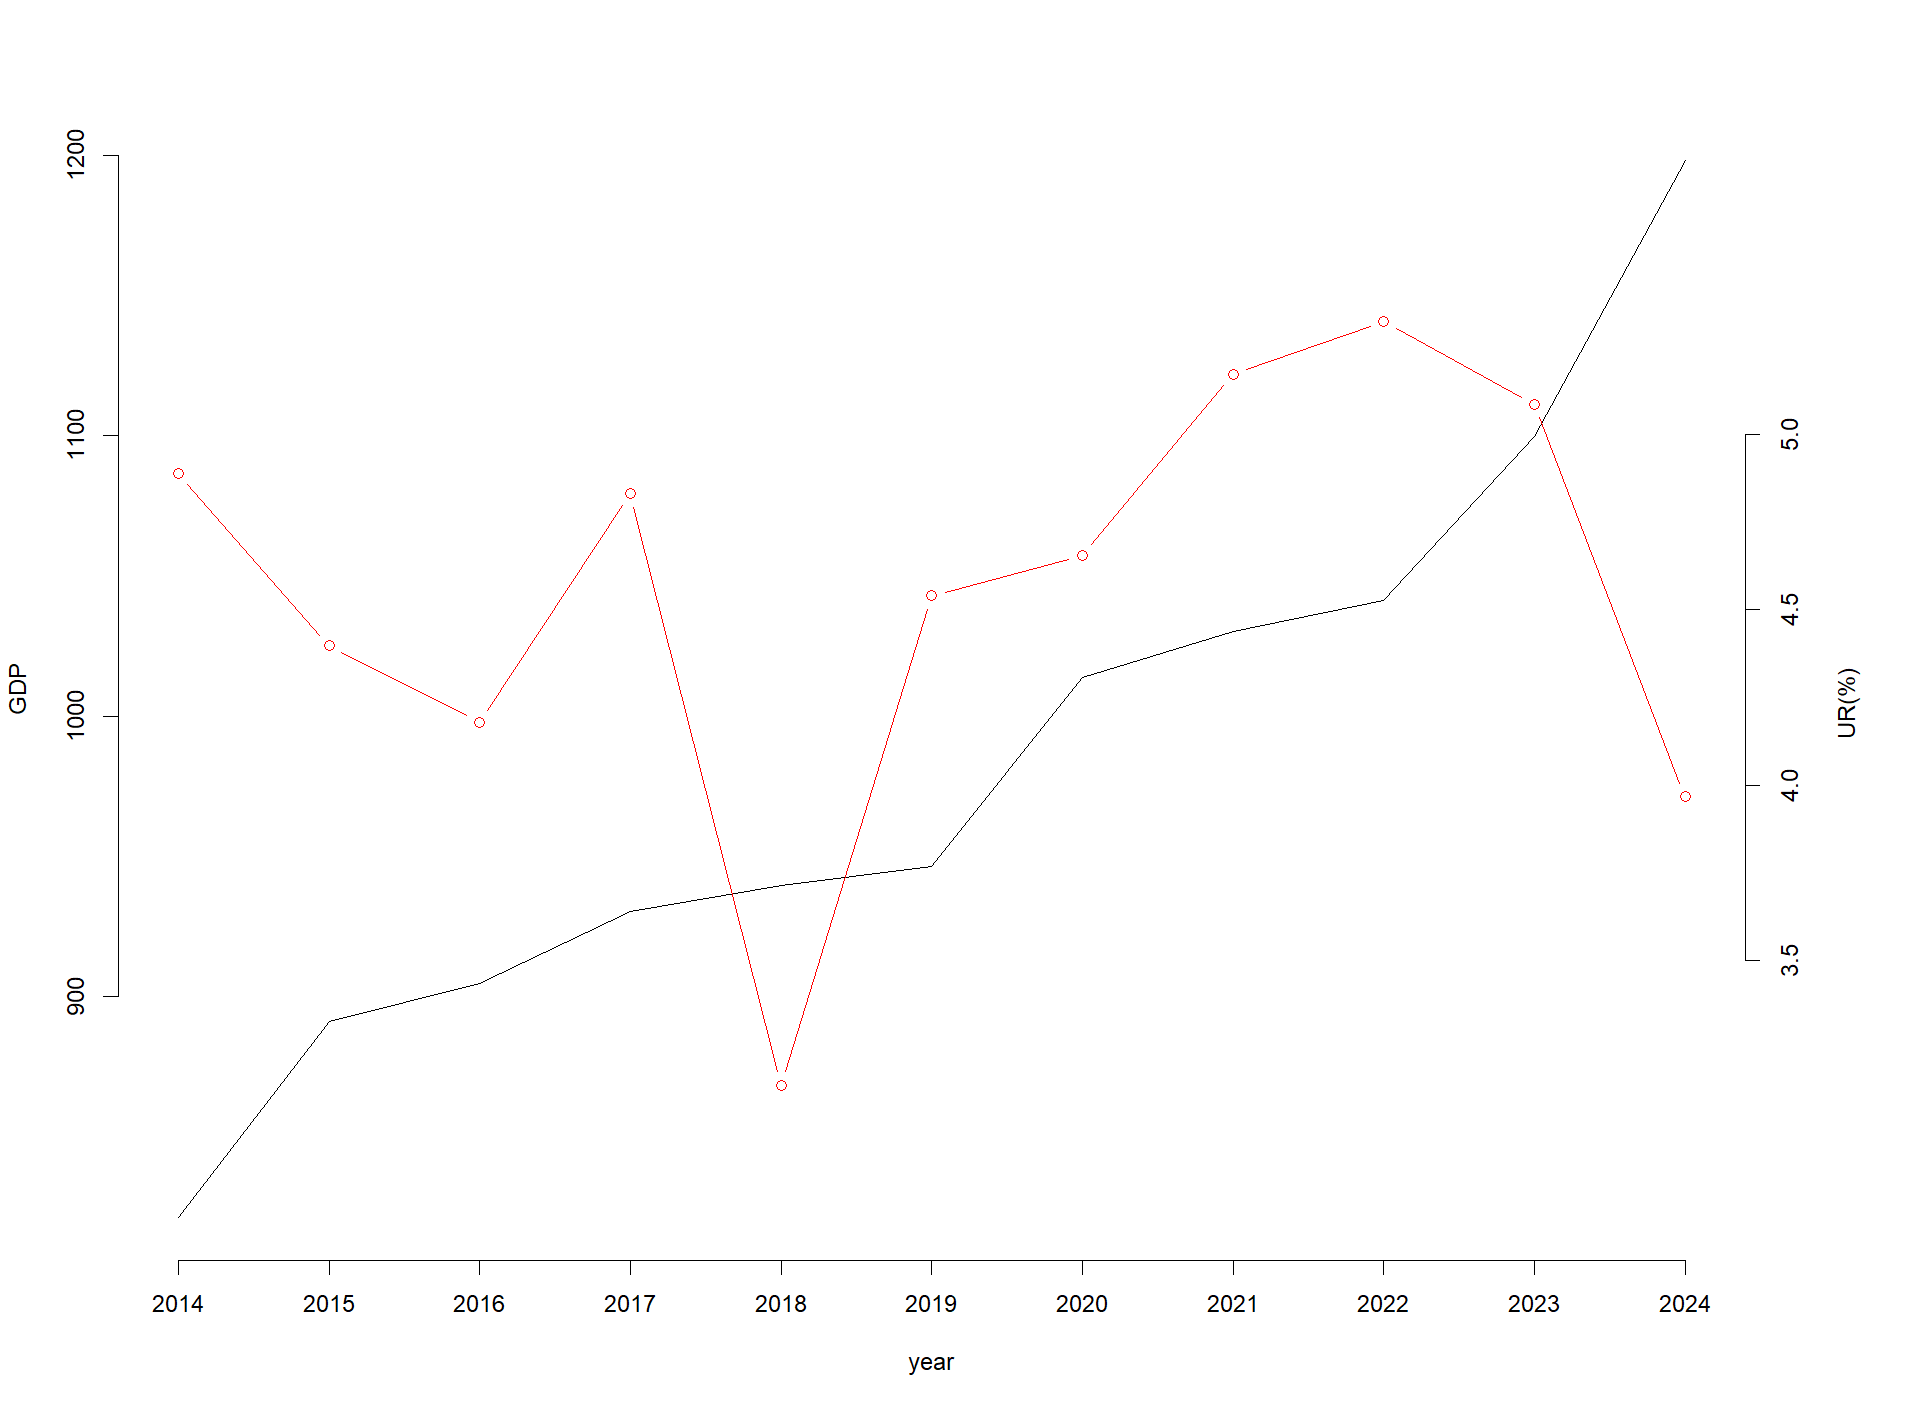
41. R 语言如何做双坐标图?
# 创建模拟数据
year <- 2014:2024
gdp <- data.frame(year, GDP = sort(rnorm(11, 1000, 100)))
ur <- data.frame(year, UR = rnorm(11, 5, 1))
par(mar = c(5, 4, 4, 6) + 0.1)
# 绘制折线图
plot(gdp ,axes=FALSE, type='l')
# 加横轴和纵轴
axis(1, at = year, label = year);axis(2)
par(new = T, mar = c(10, 4, 10 ,6) + 0.1)
# 绘制折线图2
plot(ur, axes=FALSE, xlab="", ylab="", col="red", type="b")
# 右侧加上纵轴
mtext("UR(%)", 4, 3)
axis(4)
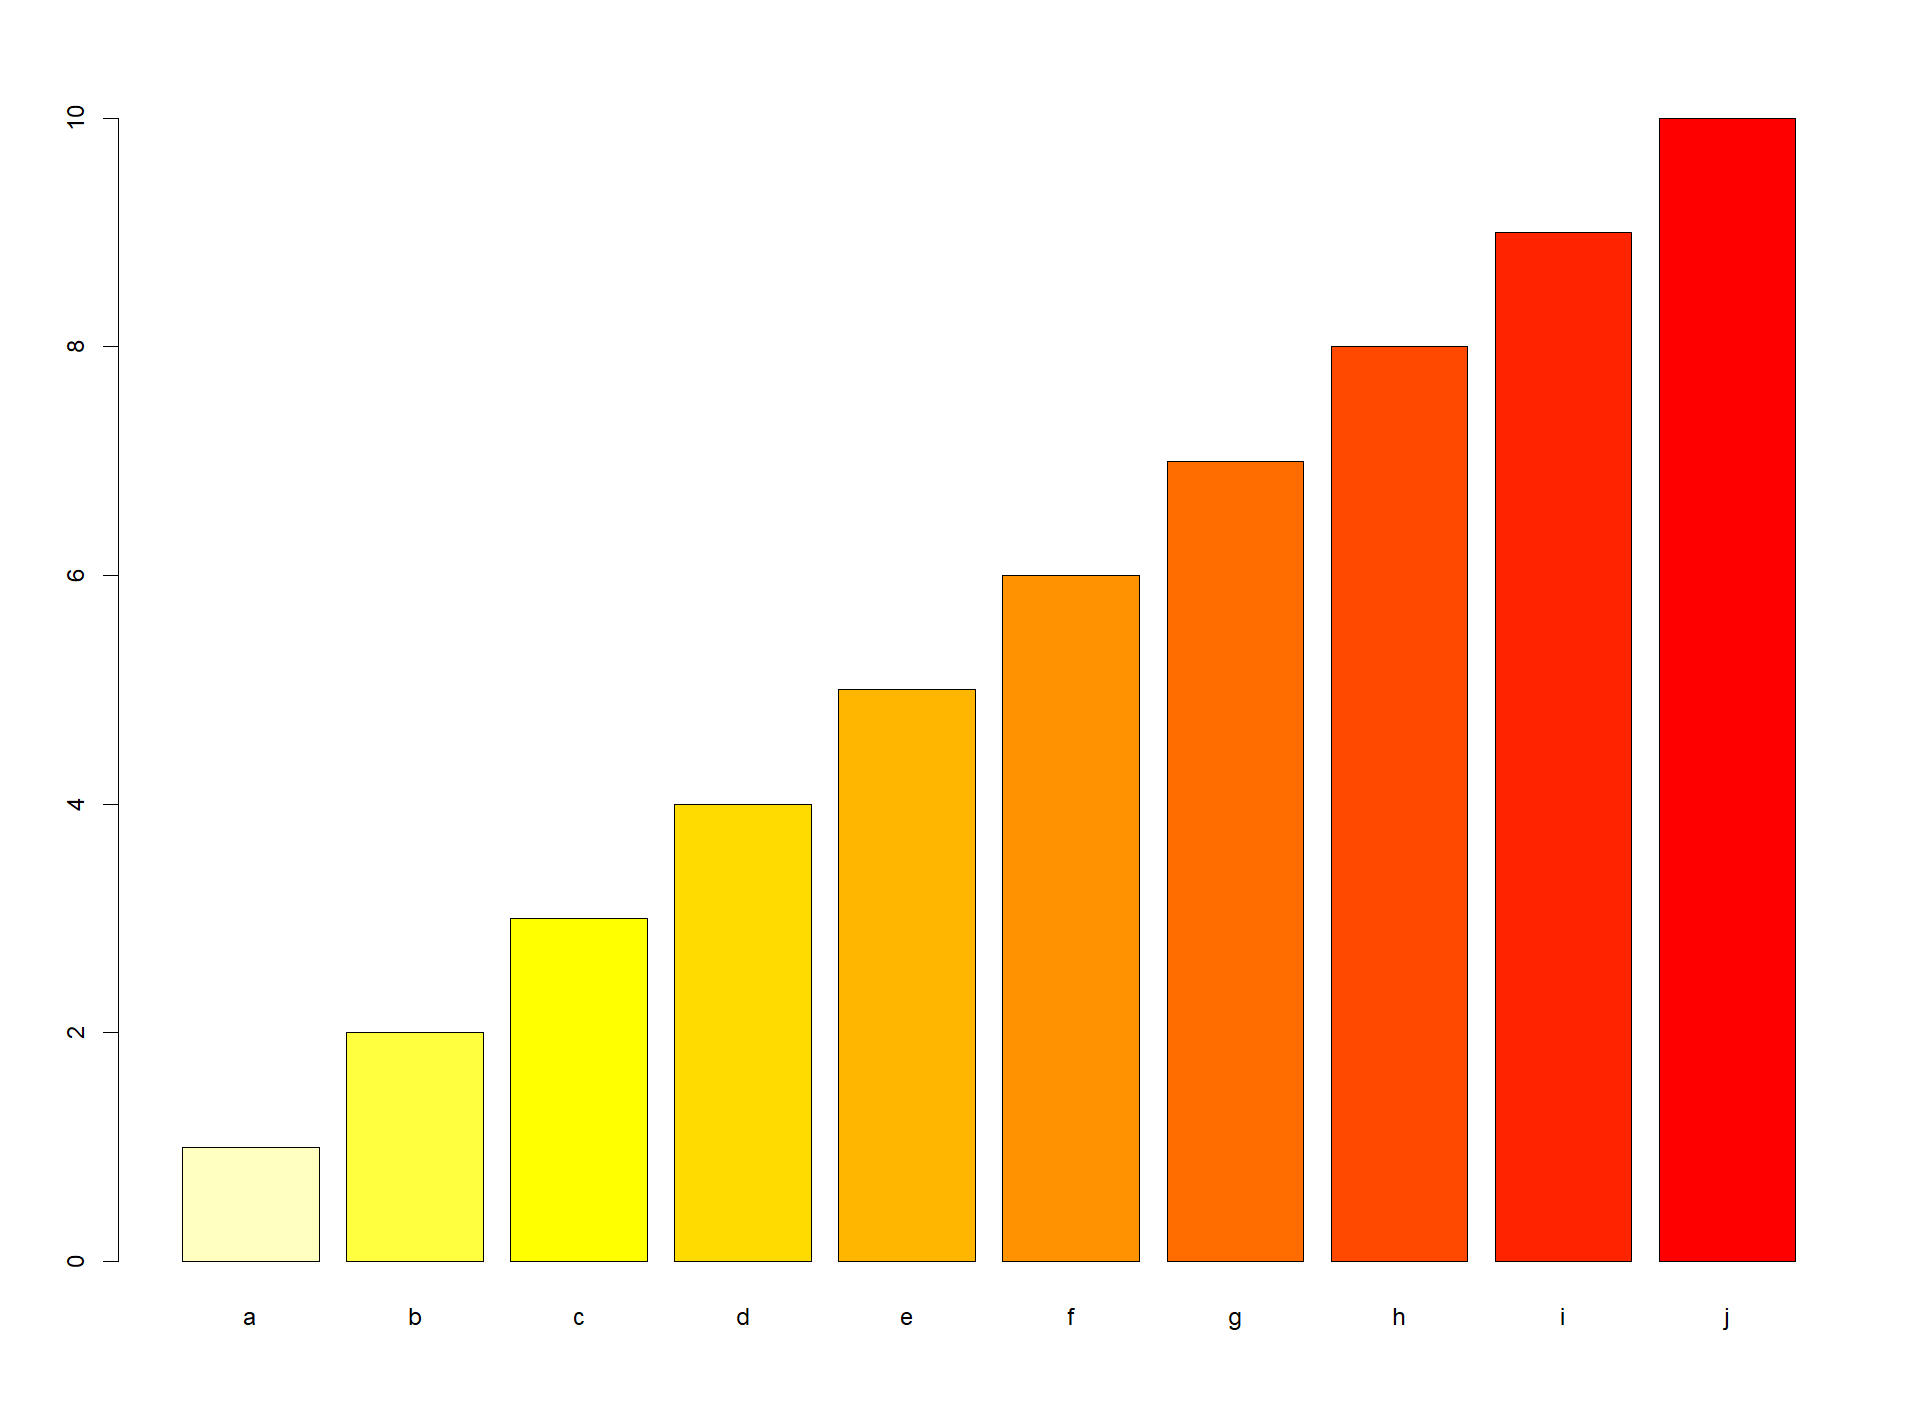
42. R 语言如何用不同的颜色来代表数据?
对于类似于barplot()高级绘图函数,可使用col参数设置。
x <- 1:10
names(x) <- letters[1:10]
barplot(x, col=rev(heat.colors(10)))
43. R 语言绘制连接若干点的平滑曲线?
使用立方曲线差值函数spline(x ,y , n)。
x <- seq(1,5,1)
y <- c(1, 3, 0.5, 5, 3)

# 绘制点图
plot(x,y, ylim = c(0,6))

# 绘制平滑曲线
sp <- spline(x, y, n=50)
lines(sp)

44. R 语言绘制连接若干点的平滑曲线?
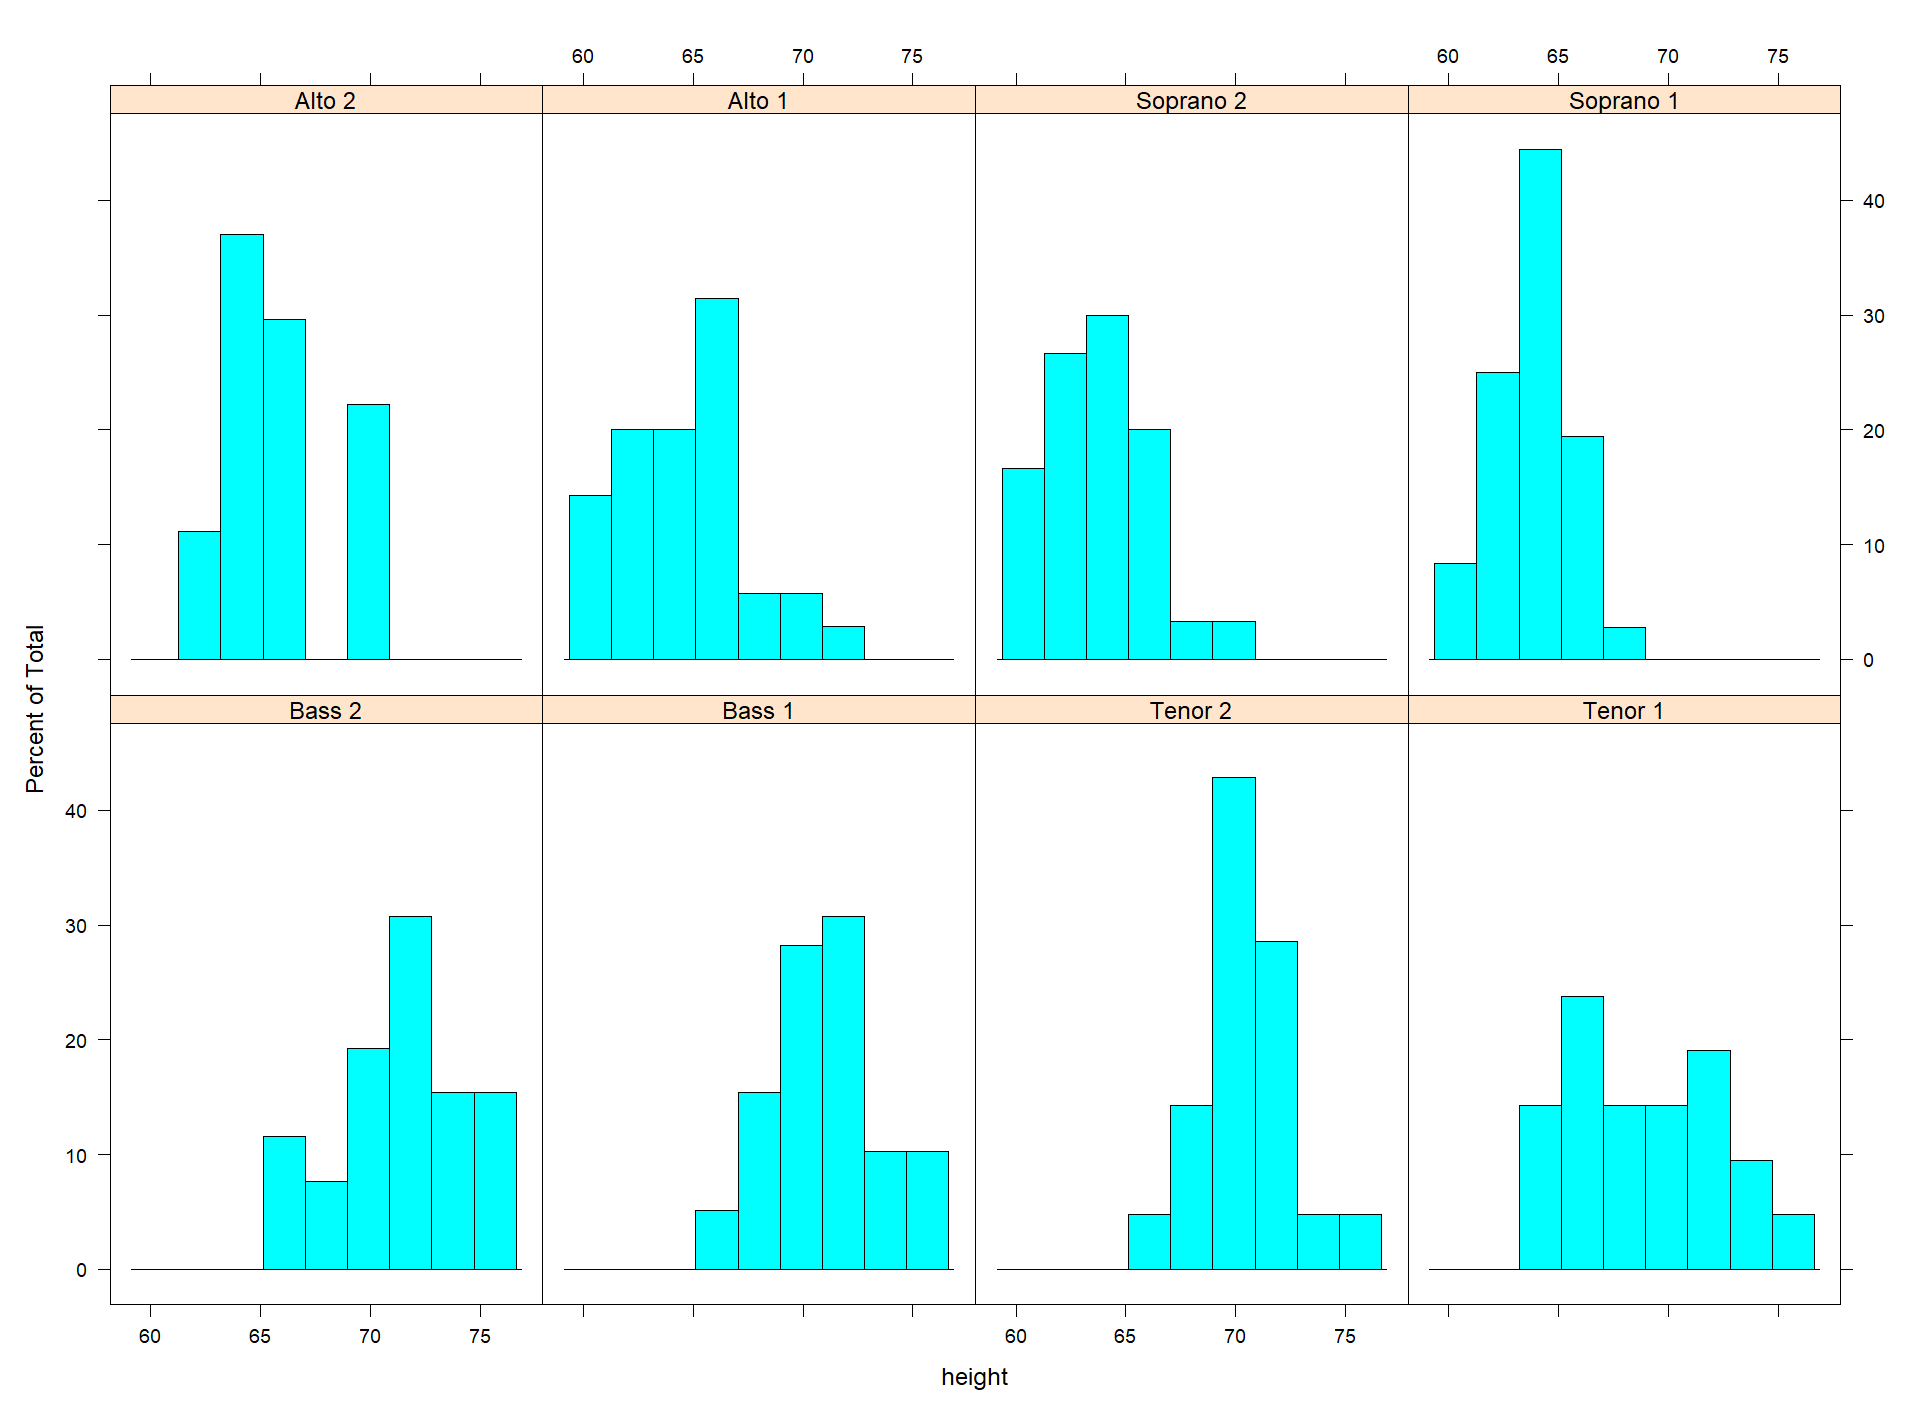
网格绘图相比于普通绘图,拥有固定的展示格式,比较难以修改。对于不同分类的数据,需要将数据各类别之间进行比较,可选择网格绘图。
library(lattice)
head(singer)
# height voice.part
# 1     64  Soprano 1
# 2     62  Soprano 1
# 3     66  Soprano 1
# 4     65  Soprano 1
# 5     60  Soprano 1
# 6     61  Soprano 1

# 绘制网格直方图
histogram(~height | voice.part, data = singer)
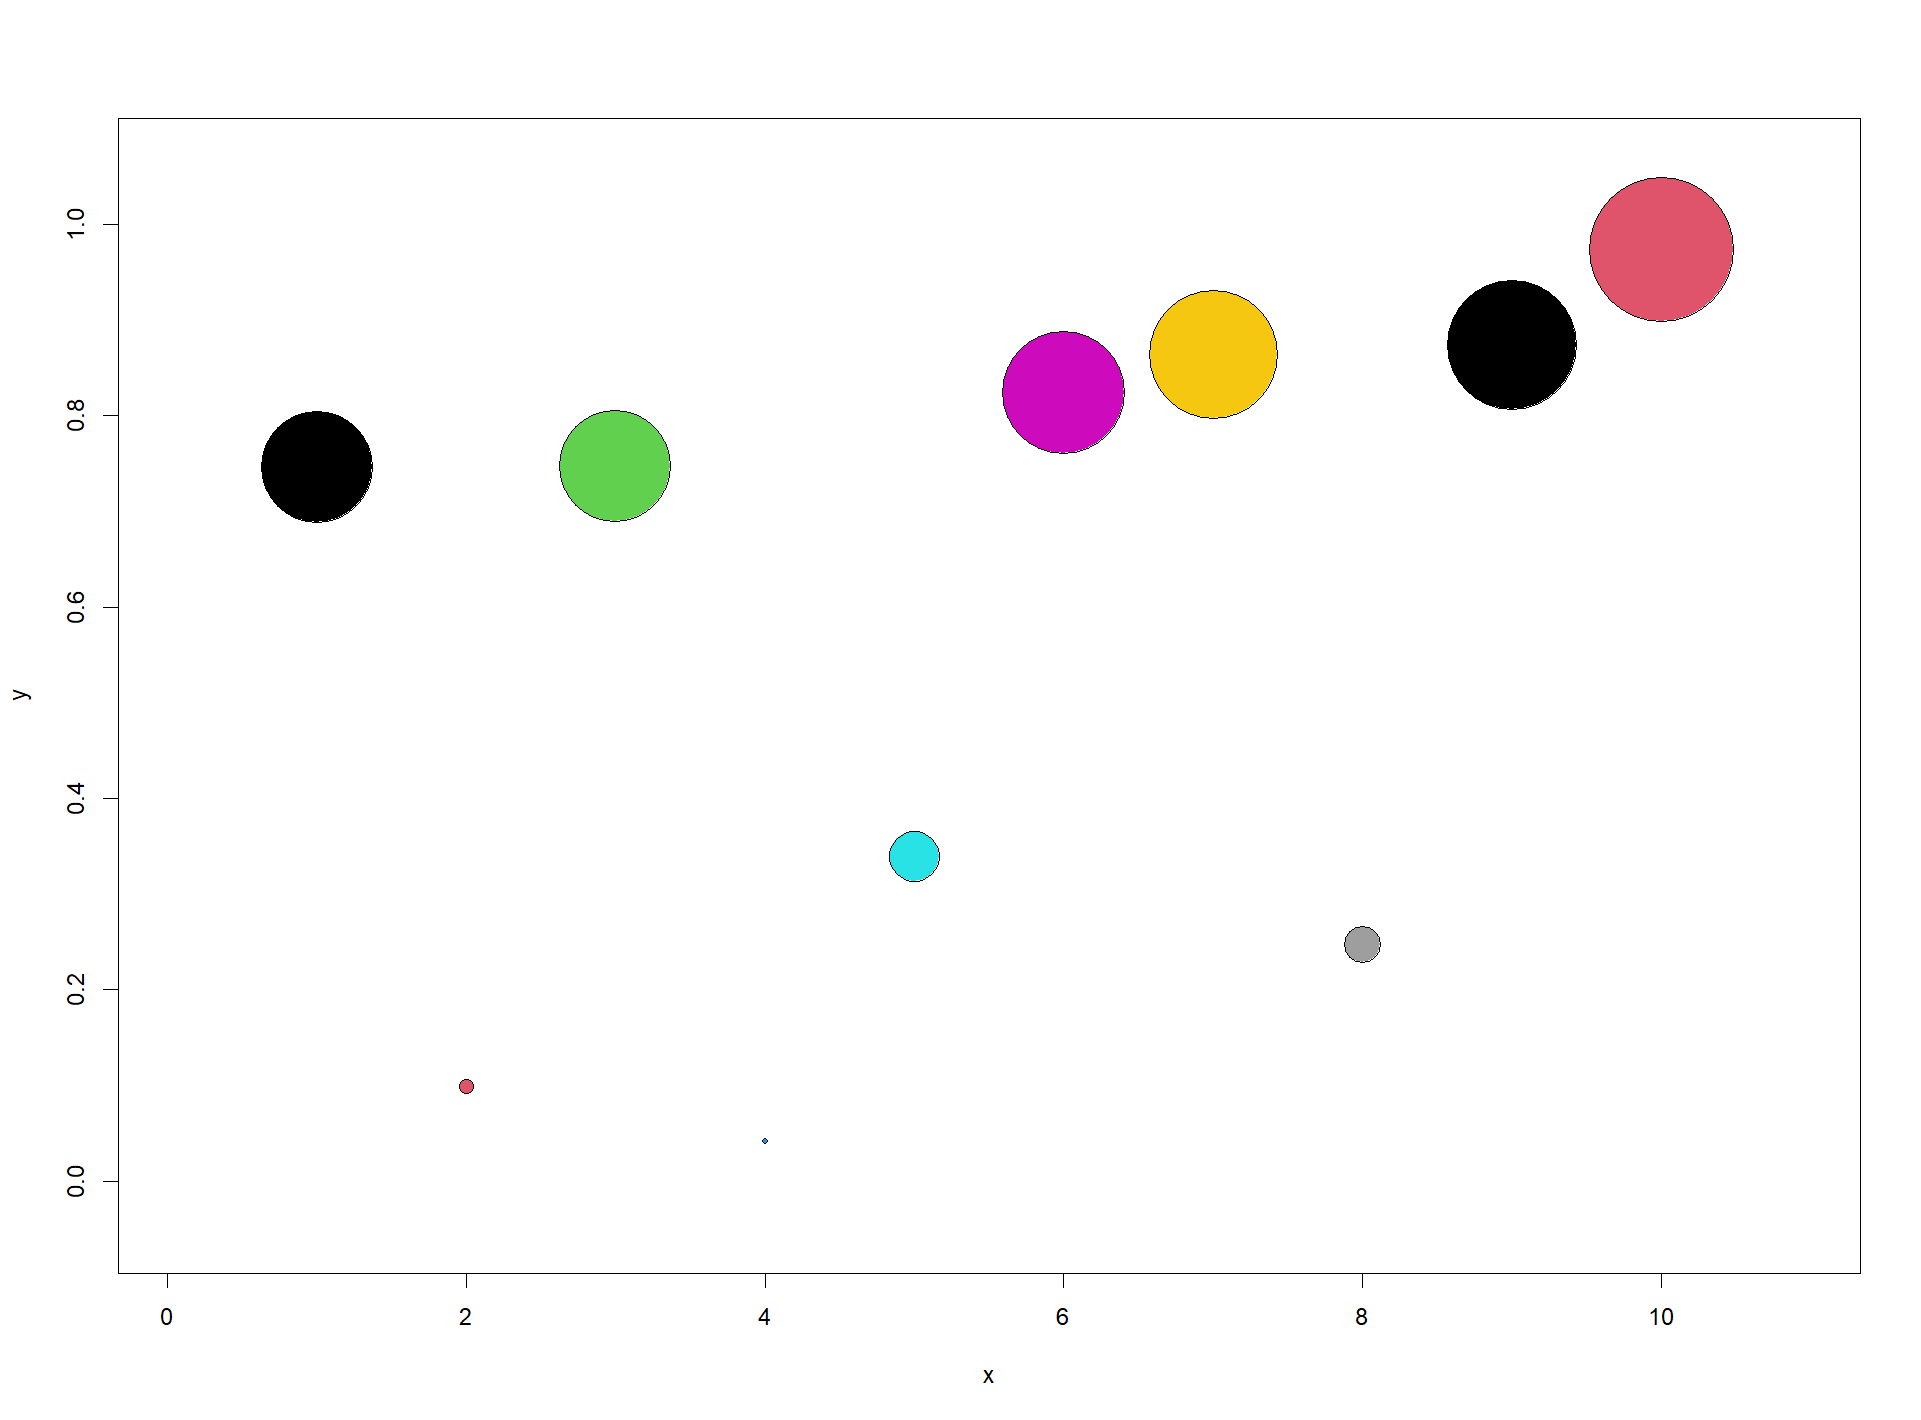
45. R 语言中如何实现散点图中散点大小随因变量值改变大小?
x <- seq(1, 10 ,1)
# [1]  1  2  3  4  5  6  7  8  9 10

# 随机生成10个数字
y <- runif(10)
# [1] 0.74641281 0.09917615 0.74748204 0.04187274 0.33943898 0.82384652 0.86378925 0.24761933
# [9] 0.87300448 0.97330164

symbols(x, y, circles = y/2, inches = F, bg=x)
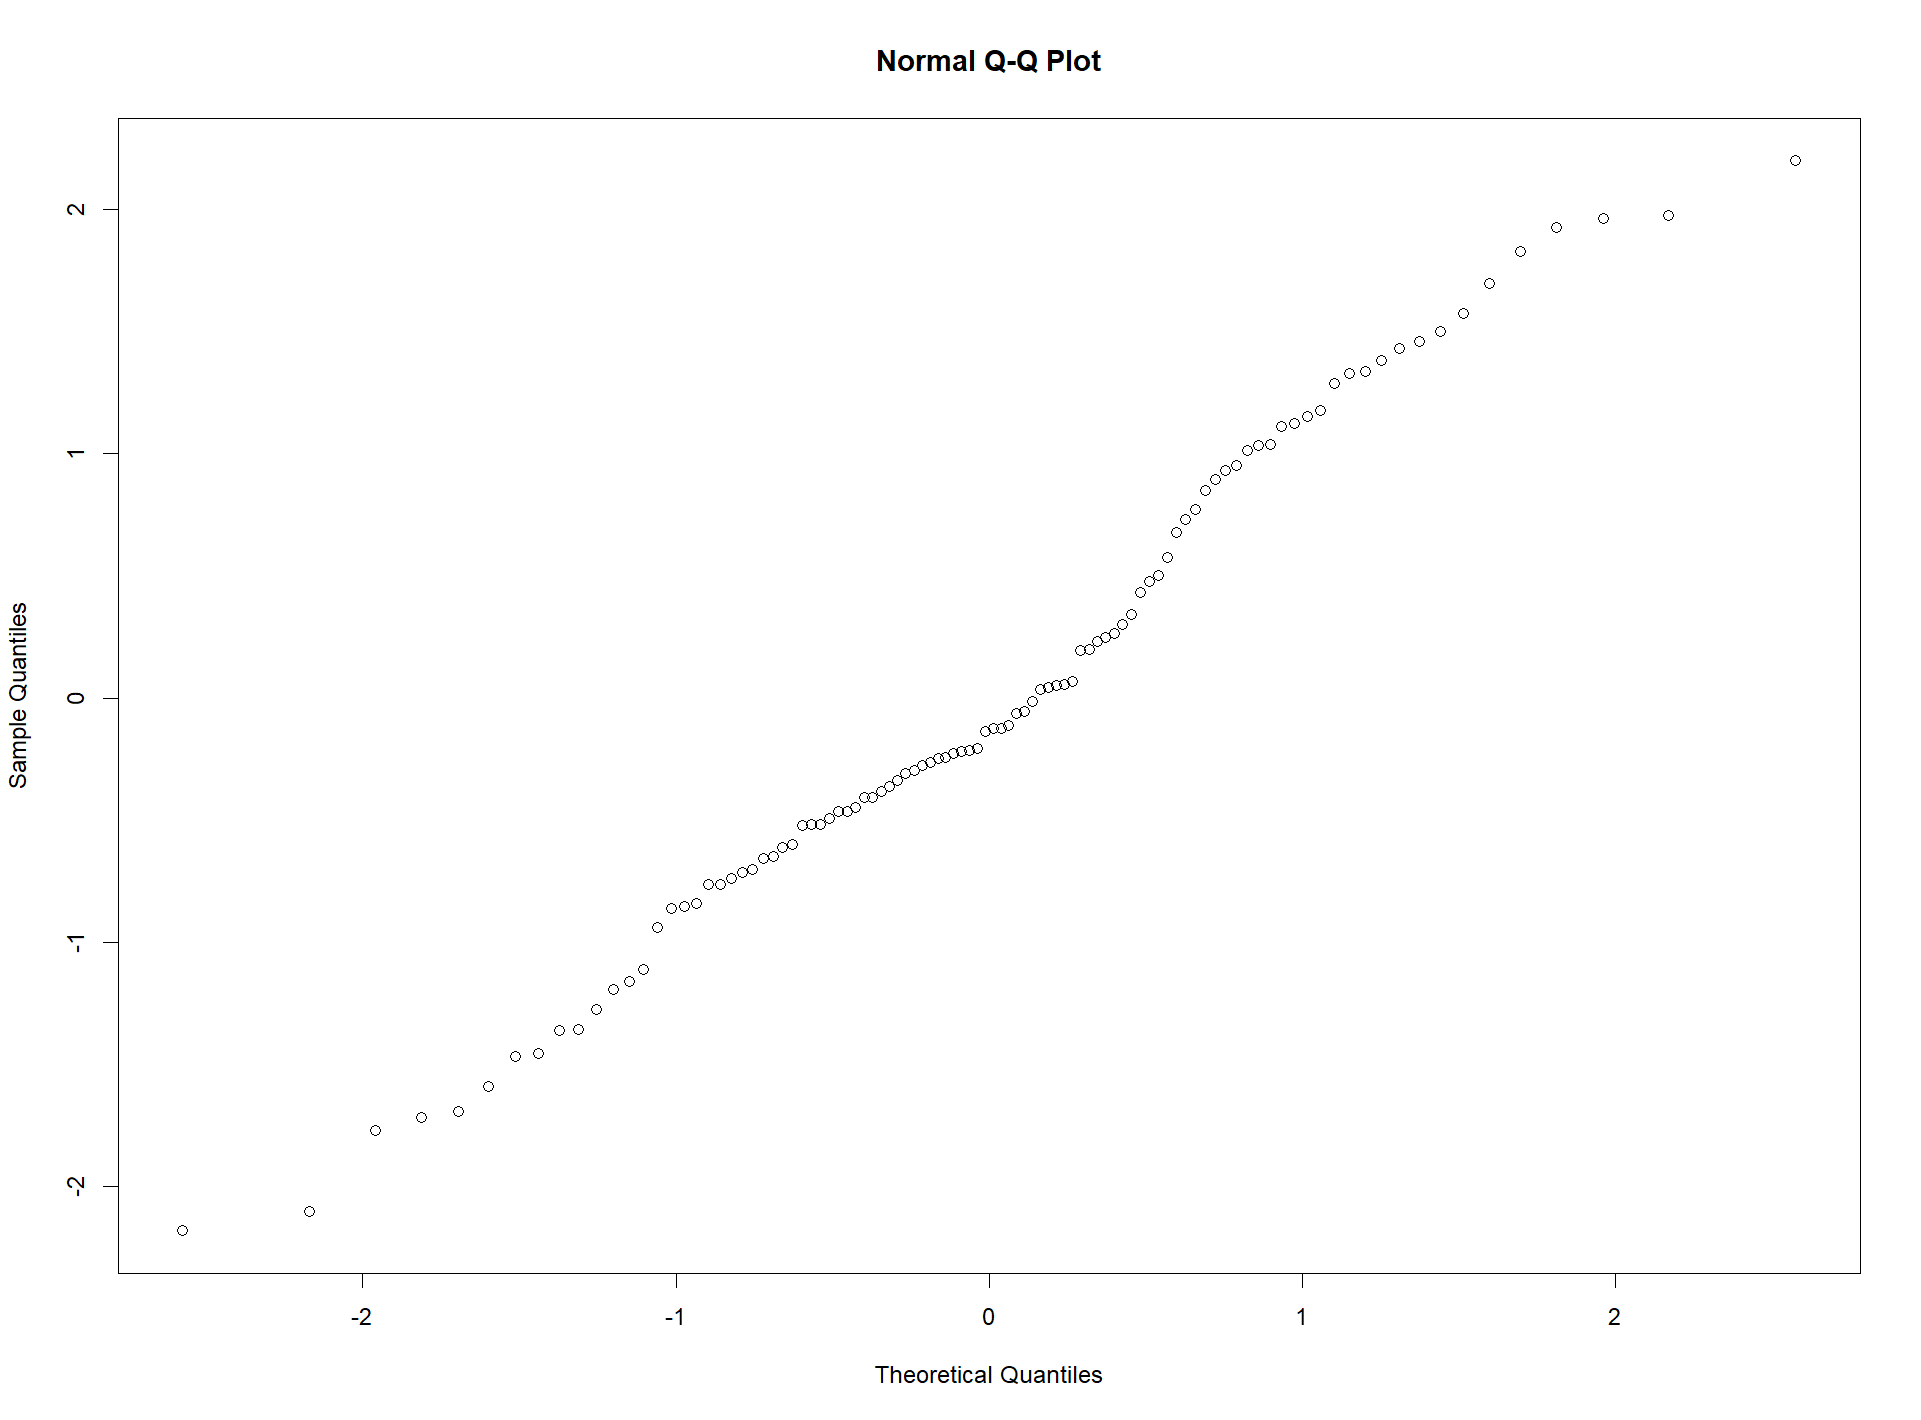
46. R 语言如何实现数据框的每一列都绘制 Q–Q 图?
# 创建data.frame数据
table <- data.frame(col1 = rnorm(100), col2 = rnorm(100,1,1))
table
# col1        col2
# 1   -0.71604351  1.28154199
# 2    0.24882503 -0.18470257
# 3    1.12548212  0.55419033
# 4   -0.12317578  1.44757020

par(ask=TRUE)
# 展示col1和col2列 QQ图结果
results = apply(table, 2, qqnorm)
par(ask=FALSE)
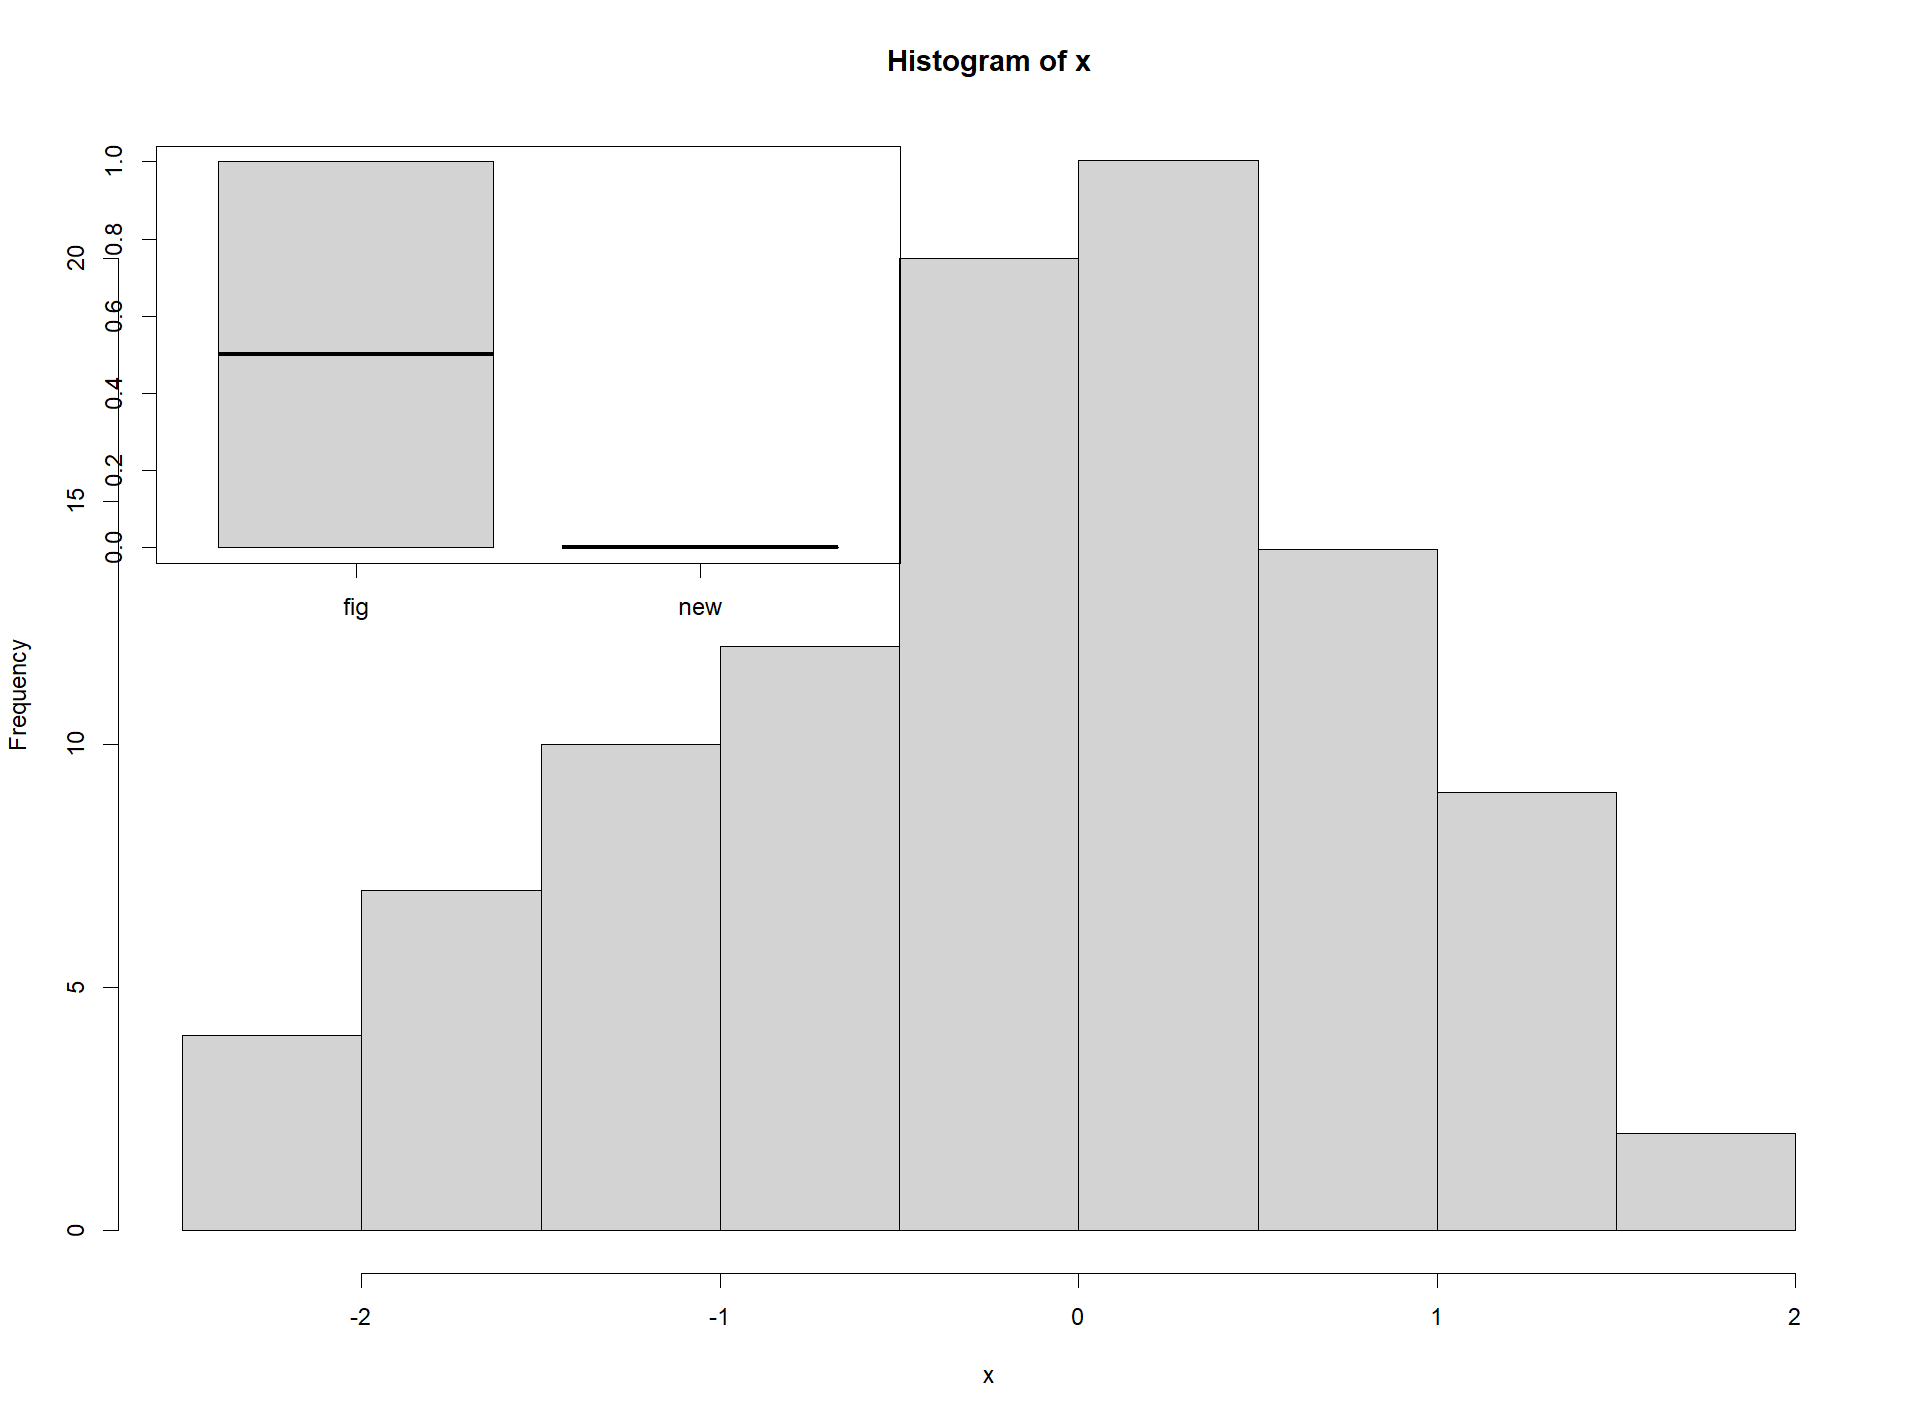
47. R 语言如何在直方图上添加一个小的箱线图?
x <- rnorm(100)
# 直方图
hist(x)

# 设置箱线图绘图参数
op <- par(fig=c(.02, .5, .5, .98), new=TRUE)
# 箱线图
boxplot(op)
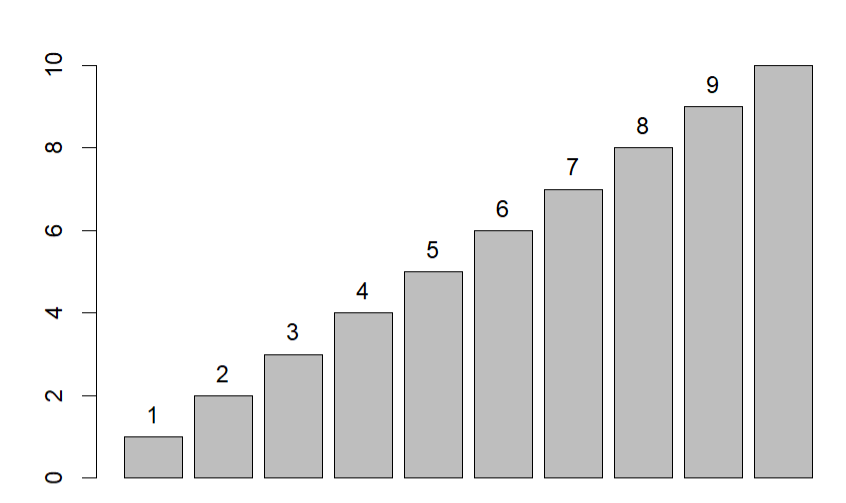
48. R 语言如何在条形图上显示每个 bar 的数值??
x <- seq(1, 10, 1)
bar <- barplot(x)
text(bar, x, labels= x, pos=3)
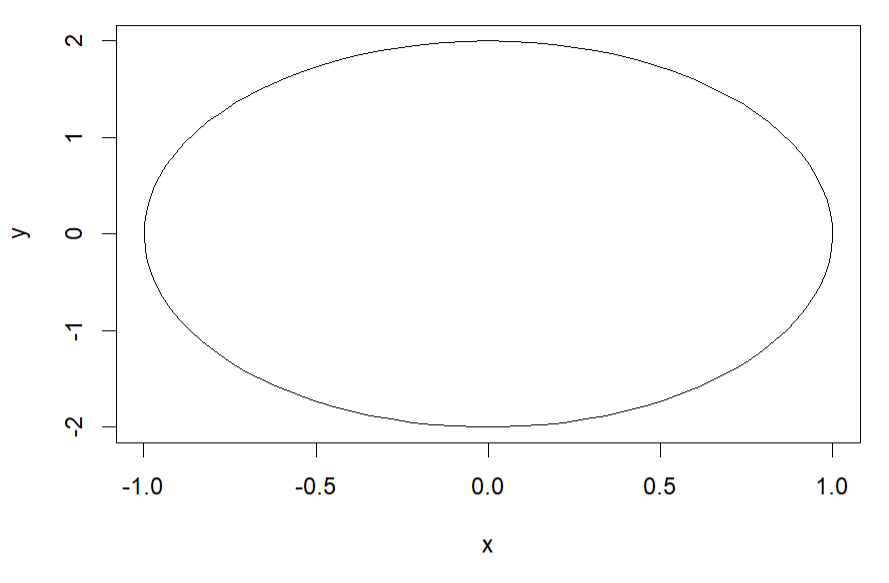
49. R 语言如何绘制椭圆或双曲线??
参考以下参数方程: 
t <- seq(0, 2*pi, length=100)
x <- sin(t) # a =1
y <- 2 * cos(t) # b=2
plot(x, y, type='l')
50. R语言计算丰度和偏度函数?
使用fBasics包函数,计算丰度和偏度。
# install.packages("fBasics")
library(fBasics)
skewness()
kurtosis()
51. R 语言如何实现线性回归模型?
线性回归模型:  其中 α 为截距项,β 为模型的斜率,² 为误差项。
lm() 的结果是一个包含回归信息的列表,它包含以下信息: coefficients:回归系数(矩阵) residuals:返回模型残差(矩阵) fitted.values:模型拟合值
head(swiss)
# Fertility Agriculture Examination Education Catholic Infant.Mortality
# Courtelary        80.2        17.0          15        12     9.96             22.2
# Delemont          83.1        45.1           6         9    84.84             22.2
# Franches-Mnt      92.5        39.7           5         5    93.40             20.2
# Moutier           85.8        36.5          12         7    33.77             20.3
# Neuveville        76.9        43.5          17        15     5.16             20.6
# Porrentruy        76.1        35.3           9         7    90.57             26.6
lm.swiss <- lm(Fertility ~ . , data=swiss)

names(lm.swiss)
# [1] "coefficients"  "residuals"     "effects"       "rank"          "fitted.values" "assign"
# [7] "qr"            "df.residual"   "xlevels"       "call"          "terms"         "model"

########### 回归模型的概要信息和
summary(lm.swiss)
# Call:
#   lm(formula = Fertility ~ ., data = swiss)
#
# Residuals:
#   Min       1Q   Median       3Q      Max
# -15.2743  -5.2617   0.5032   4.1198  15.3213
#
# Coefficients:
#   Estimate Std. Error t value Pr(>|t|)
# (Intercept)      66.91518   10.70604   6.250 1.91e-07 ***
#   Agriculture      -0.17211    0.07030  -2.448  0.01873 *
#   Examination      -0.25801    0.25388  -1.016  0.31546
# Education        -0.87094    0.18303  -4.758 2.43e-05 ***
#   Catholic          0.10412    0.03526   2.953  0.00519 **
#   Infant.Mortality  1.07705    0.38172   2.822  0.00734 **
#   ---
#   Signif. codes:  0 ‘***’ 0.001 ‘**’ 0.01 ‘*’ 0.05 ‘.’ 0.1 ‘ ’ 1
#
# Residual standard error: 7.165 on 41 degrees of freedom
# Multiple R-squared:  0.7067,  Adjusted R-squared:  0.671
# F-statistic: 19.76 on 5 and 41 DF,  p-value: 5.594e-10

########### 方差分析表
anova(lm.swiss)
# Analysis of Variance Table
#
# Response: Fertility
# Df  Sum Sq Mean Sq F value    Pr(>F)
# Agriculture       1  894.84  894.84 17.4288 0.0001515 ***
#   Examination       1 2210.38 2210.38 43.0516 6.885e-08 ***
#   Education         1  891.81  891.81 17.3699 0.0001549 ***
#   Catholic          1  667.13  667.13 12.9937 0.0008387 ***
#   Infant.Mortality  1  408.75  408.75  7.9612 0.0073357 **
#   Residuals        41 2105.04   51.34
# ---
#   Signif. codes:  0 ‘***’ 0.001 ‘**’ 0.01 ‘*’ 0.05 ‘.’ 0.1 ‘ ’ 1
52. R 语言如何更新模型?
使用update()函数。
# 原模型f0
summary(f0 <- lm(Fertility ~ ., data=swiss))

$ 更新模型f1
f1 <- update(f0, .~. - Examination)
summary(f1)
53. R 语言如何在得到一个正态总体均值u的区间估计?
使用t.test()函数。
x <- rnorm(100)
t.test(x) # -0.1410437  0.2710209
# One Sample t-test
#
# data:  x
# t = 0.62588, df = 99, p-value = 0.5328
# alternative hypothesis: true mean is not equal to 0
# 95 percent confidence interval:
#   -0.1410437  0.2710209
# sample estimates:
#   mean of x
# 0.06498862
54. R 语言如何做主成分分析?
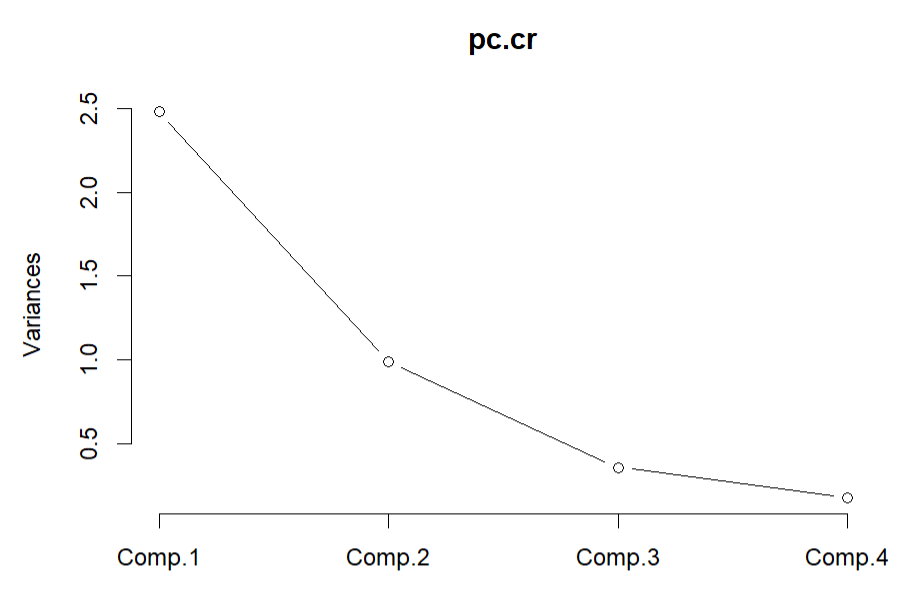
pc.cr <-stats::princomp(USArrests, cor=TRUE)
# Call:
#   princomp(x = USArrests, cor = TRUE)
#
# Standard deviations:
#   Comp.1    Comp.2    Comp.3    Comp.4
# 1.5748783 0.9948694 0.5971291 0.4164494
#
# 4  variables and  50 observations.

plot(pc.cr, type="lines")
loadings(pc.cr)
# Loadings:
#   Comp.1 Comp.2 Comp.3 Comp.4
# Murder    0.536  0.418  0.341  0.649
# Assault   0.583  0.188  0.268 -0.743
# UrbanPop  0.278 -0.873  0.378  0.134
# Rape      0.543 -0.167 -0.818
#
# Comp.1 Comp.2 Comp.3 Comp.4
# SS loadings      1.00   1.00   1.00   1.00
# Proportion Var   0.25   0.25   0.25   0.25
# Cumulative Var   0.25   0.50   0.75   1.00
55. R 语言如何实现配对 t 检验??
require(stats)
t.test(extra ~ group, data=sleep, paried=TRUE)

# Welch Two Sample t-test
#
# data:  extra by group
# t = -1.8608, df = 17.776, p-value = 0.07939
# alternative hypothesis: true difference in means between group 1 and group 2 is not equal to 0
# 95 percent confidence interval:
#   -3.3654832  0.2054832
# sample estimates:
#   mean in group 1 mean in group 2
# 0.75            2.33

# 常用检验
apropos("test")

56. R 语言如何实现方差分析(ANOVA)?
方差分析同线性回归模型很类似,毕竟它们都是线性模型。最简单实现方差分析的函数为 aov()。

57. R 语言如何计算回归模型的置信区间?
参考 confint函数。
fit <- lm(100 / mpg ~ disp + hp + wt + am, data=mtcars)
confint(fit)
# 2.5 %      97.5 %
#   (Intercept) -0.774822875 2.256118188
# disp        -0.002867999 0.008273849
# hp          -0.001400580 0.011949674
# wt           0.380088737 1.622517536
# am          -0.614677730 0.926307310

confint(fit, "wt")
# 2.5 %   97.5 %
#   wt 0.3800887 1.622518
58. R 语言如何求 Spearman 等级(或 kendall)相关系数?
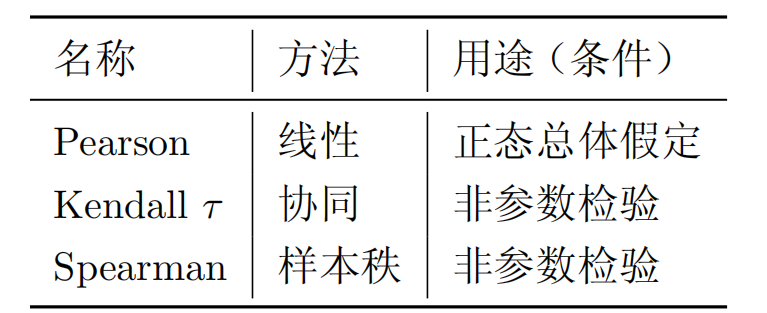
cor() 函数默认为求出 Person 相关系数,修改其 method 参数即可求得 Kendall τ 和 Spearman 秩 相关系数。
cor(longley, method = "spearman")
# GNP.deflator       GNP Unemployed Armed.Forces Population      Year  Employed
# GNP.deflator    1.0000000 0.9970588  0.6647059    0.2205882  0.9970588 0.9970588 0.9823529
# GNP             0.9970588 1.0000000  0.6382353    0.2235294  0.9941176 0.9941176 0.9852941
# Unemployed      0.6647059 0.6382353  1.0000000   -0.3411765  0.6852941 0.6852941 0.5647059
# Armed.Forces    0.2205882 0.2235294 -0.3411765    1.0000000  0.2264706 0.2264706 0.2264706
# Population      0.9970588 0.9941176  0.6852941    0.2264706  1.0000000 1.0000000 0.9764706
# Year            0.9970588 0.9941176  0.6852941    0.2264706  1.0000000 1.0000000 0.9764706
# Employed        0.9823529 0.9852941  0.5647059    0.2264706  0.9764706 0.9764706 1.0000000
59. 如何使用 R 做生存分析?
使用survival 包。
library(survival)
fit <- survfit(Surv(time ,status) ~ x, data=aml)
plot(fit)
survial_data <- cbind(fit$time, fit$n.risk, fit$n.event, fit$surv)
# [,1] [,2] [,3]       [,4]
# [1,]    9   11    1 0.90909091
# [2,]   13   10    1 0.81818182
# [3,]   18    8    1 0.71590909
# [4,]   23    7    1 0.61363636
# [5,]   28    6    0 0.61363636
# [6,]   31    5    1 0.49090909

60. 如何释放 R 运行后占用的内存?
因为 R 是在内存中运算,所以当 R 读入了体积比较大的数据后,即使删除了相关对象,内存空间 仍不能释放。gc() 函数虽然主要用来报告内存使用情况,但是一个重要的用途便是释放内存。
gc()
![]() R语言
360 人阅读
|
0 人回复
|
2024-07-06
R语言
360 人阅读
|
0 人回复
|
2024-07-06