
本期教程
「小杜的生信笔记」,自2021年11月开始做的知识分享,主要内容是「R语言绘图教程」、「转录组上游分析」、**「转录组下游分析」**等内容。凡事在社群同学,可免费获得自2021年11月份至今全部教程,教程配备事例数据和相关代码,我们会持续更新中。
往期教程部分内容

数据处理
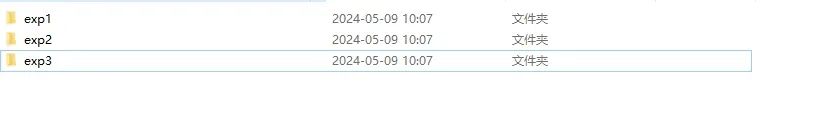
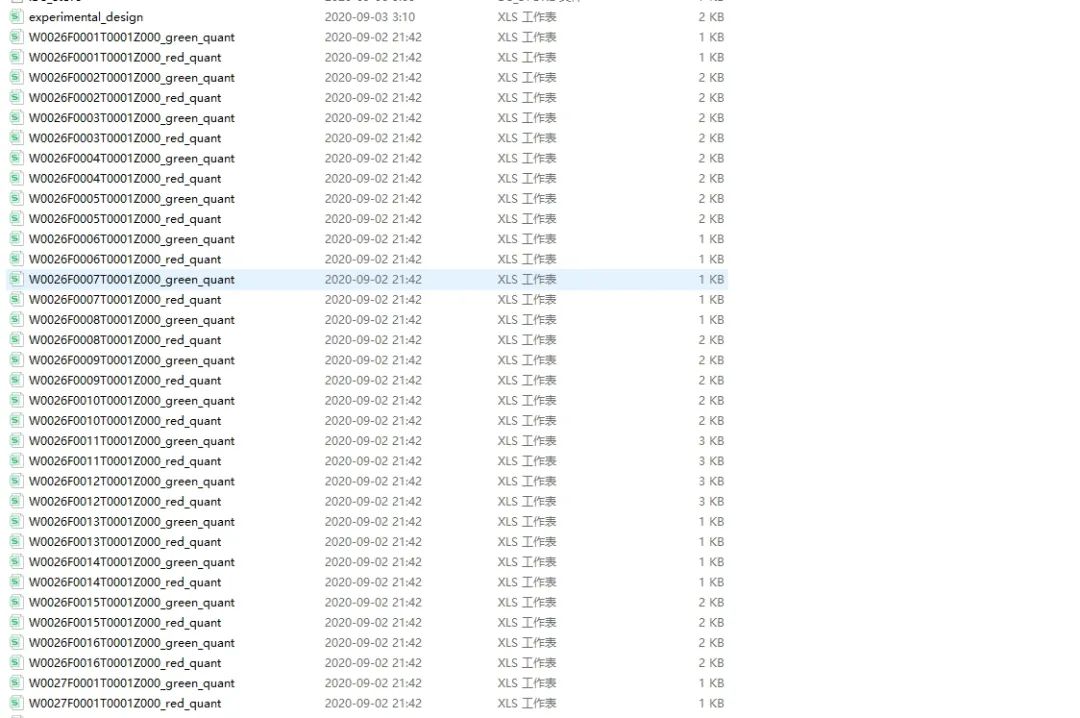
有N个数据需要进行处理,每个文件中有N个文件,如下所示。需进行批量处理数据。
加载R包
setwd("D:\\BioinfoFile\\小杜的生信笔记\\2024\\20240511_分析手稿中IFN治疗的成像数据")

##'@导入所需R包
library('stringr')
library('tidyverse')
library('ggplot2')
创建分析文件夹
dir.create(file.path(".","figure"),showWarnings = TRUE)
dir.create(file.path(".","result"),showWarnings = TRUE)
加载数据及提取
base_path = "./ifn_treatment/"
replicates = list.files(base_path,"exp.*")
data.ifn = NULL
# For each replicate experiment
for( replicate in replicates ){
data.rep = NULL# data.frame with measurement for one replicate
replicate_path = paste(base_path,replicate,"/",sep="")
files_list = list.files(replicate_path,".*red_quant.csv")
# For each sample within a replicate experiment
for( file_name in files_list ){
well_id = str_extract(file_name,"W\\d+")
fv_id = str_extract(file_name,"F\\d+")
data_red = read.csv(paste(replicate_path,file_name,sep=""),sep=",",row.names=1)
data_green = read.csv(paste(replicate_path,gsub("red","green",file_name),sep=""),sep=",",row.names=1)
data = merge(data_red, data_green, by="row.names",suffix=c("_red","_green"))
data$cell_id = paste(data$Row.names)
data$well_id = well_id
data$fv_id = fv_id
data$replicate = replicate
data$Row.names = NULL
data = data[,c("well_id","fv_id","cell_id","replicate","Area_red","Mean_red","Median_red","Mean_green","Median_green")]
if(is.null(data.rep)){
data.rep = data
} else {
data.rep = rbind(data.rep,data)
}
}
#retrieve experimental design
exp_design = read.csv(paste(replicate_path,"experimental_design.csv",sep=""),sep=","); exp_design$cell_num = as.factor(exp_design$cell_num);
#merge results table with experimental design
data_m = as_tibble(merge(data.rep, exp_design, by.x="well_id", by.y="well"))
#merge table with previous replicates
if(is.null(data.ifn)){
data.ifn = data_m
} else {
data.ifn = rbind(data.ifn, data_m)
}
}
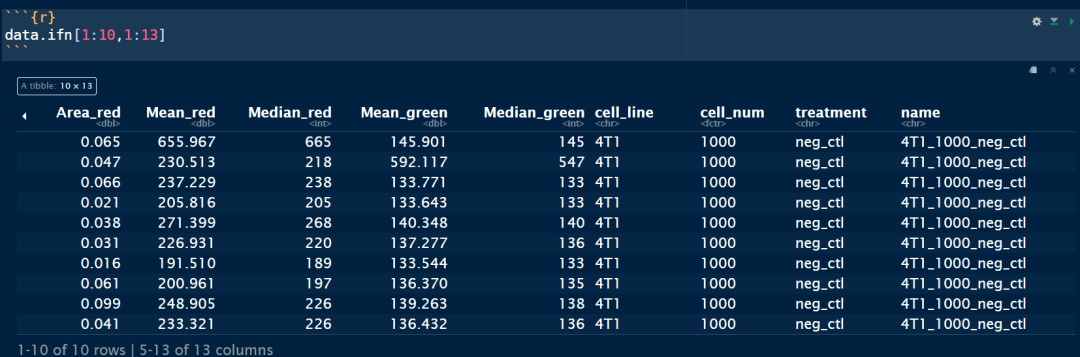
### Quality control
str(data.ifn)
summary(data.ifn)
dim(data.ifn)
保存数据
write.csv(data.ifn,"./result/data.ifn.output.csv")
绘图
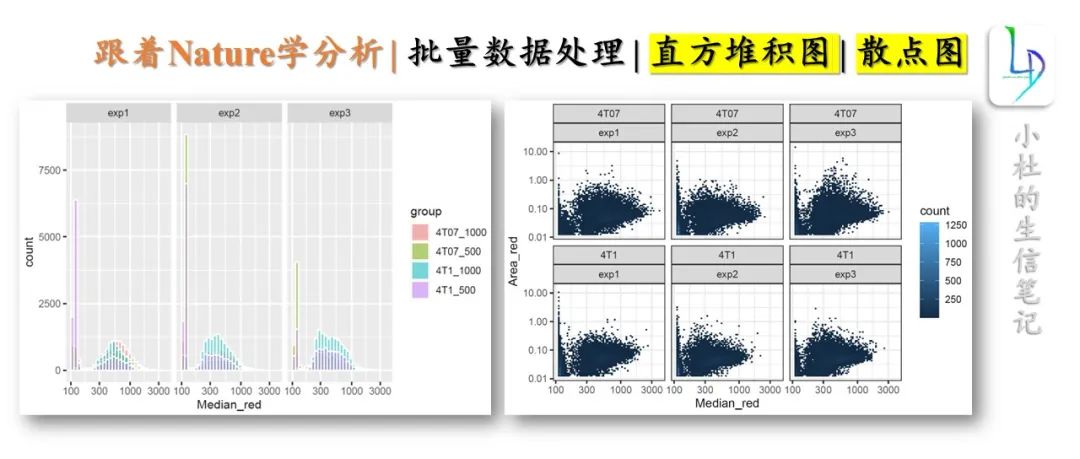
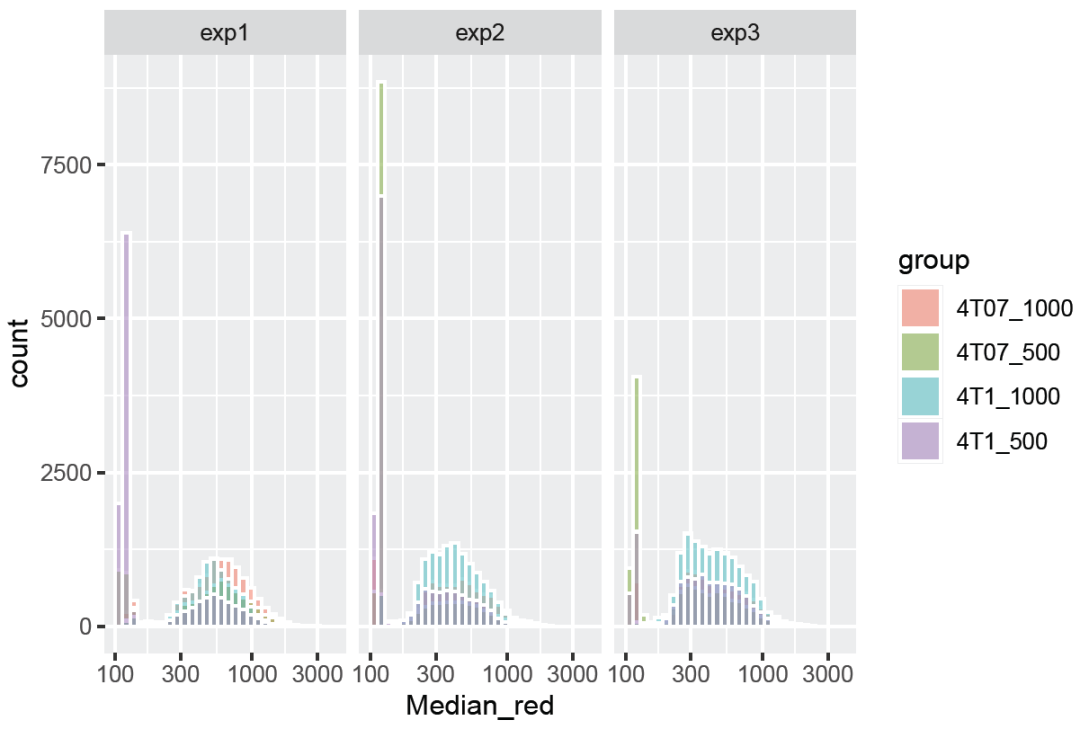
- 绘制直方堆积图
ggplot(data.ifn %>%
         mutate(group = paste(cell_line,"_",cell_num,sep="")),
       aes(x=Median_red, fill=group))+
  geom_histogram(color = "white", alpha = 0.5, position = "identity")+
  scale_x_log10()+ ##'@X轴进行log10()处理
   facet_wrap(~ replicate)
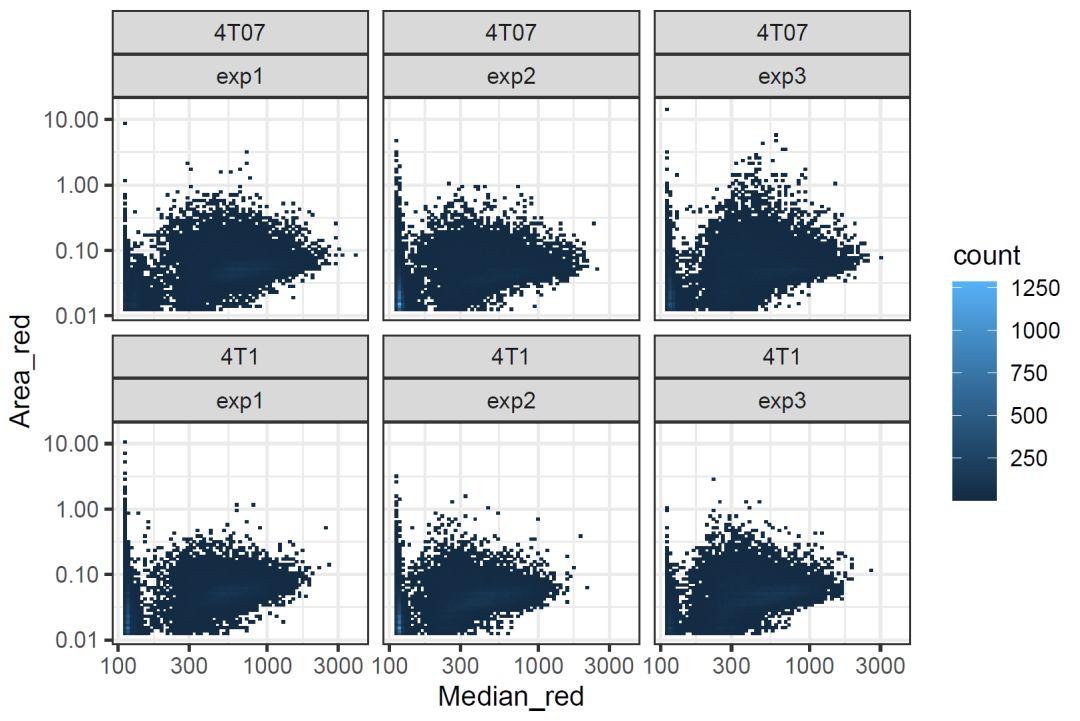
 2. 散点图
ggplot(data.ifn, aes(x=Median_red, y=Area_red) ) +
  geom_bin2d(bins = 70) +
  facet_wrap(~ cell_line+replicate) +
  scale_x_log10() +
  scale_y_log10() +
  theme_bw()
若我们的教程对你有所帮助,请点赞+收藏+转发,这是对我们最大的支持。
往期部分文章
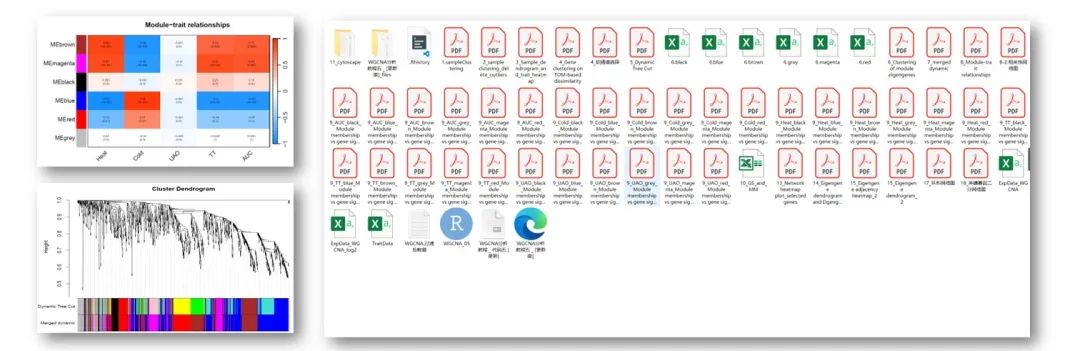
「1. 最全WGCNA教程(替换数据即可出全部结果与图形)」
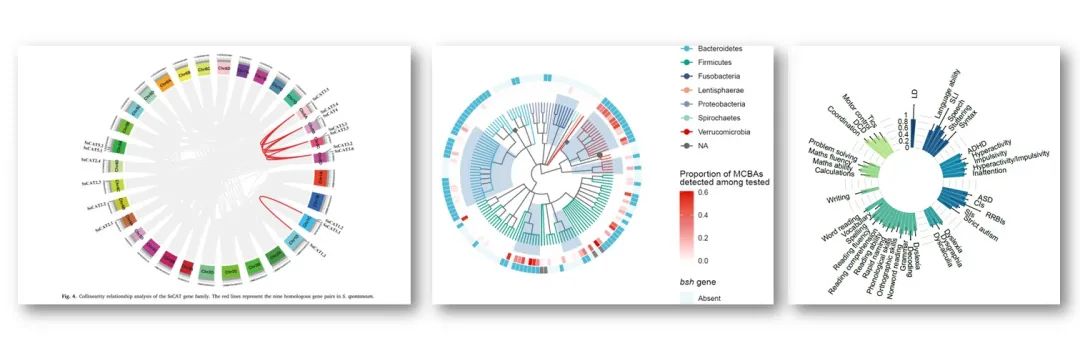
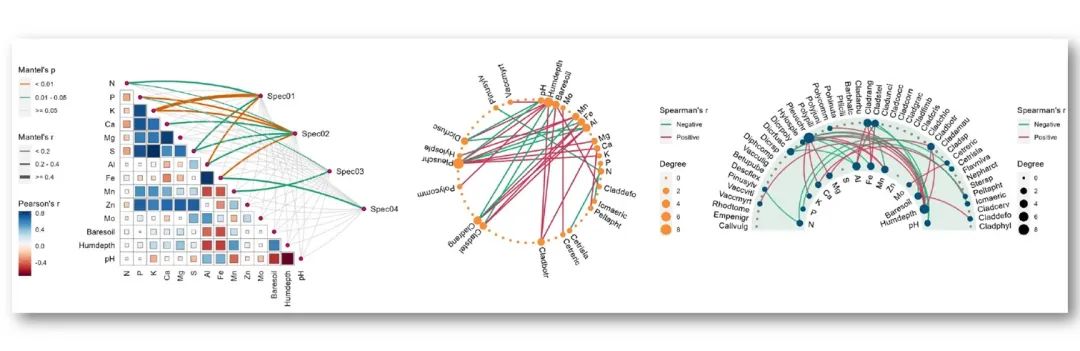
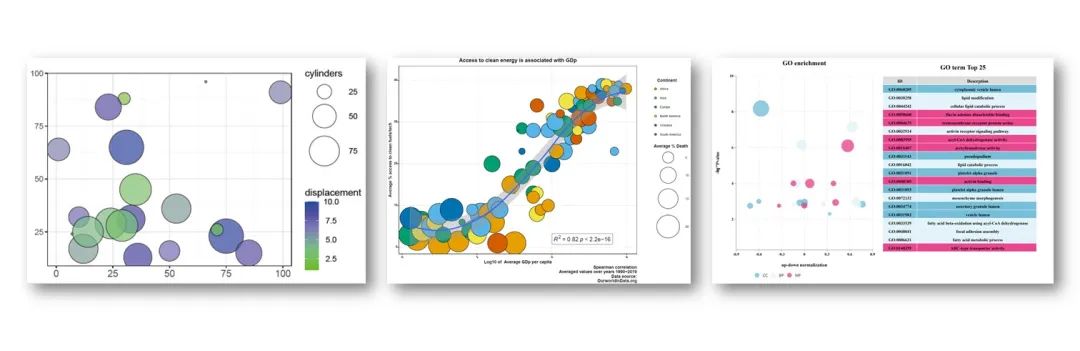
「2. 精美图形绘制教程」
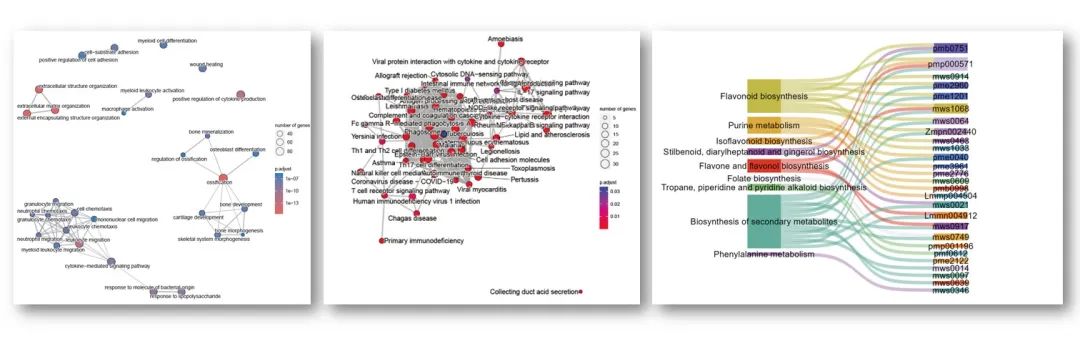
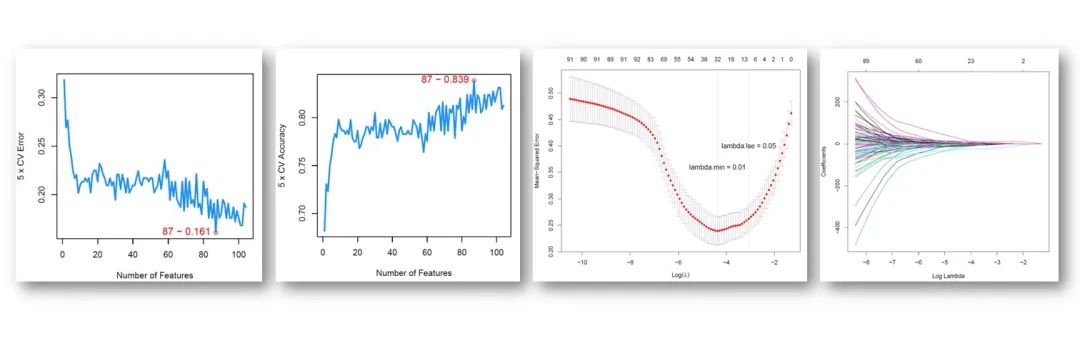
「3. 转录组分析教程」
「4. 转录组下游分析」
「小杜的生信筆記」 ,主要发表或收录生物信息学教程,以及基于R分析和可视化(包括数据分析,图形绘制等);分享感兴趣的文献和学习资料!!


 苏公网安备32011502012024号