本期教程

获得本期教程文本教程,「回复关键词」:**20240520**
❝
「小杜的生信笔记」,自2021年11月开始做的知识分享,主要内容是「R语言绘图教程」、「转录组上游分析」、**「转录组下游分析」**等内容。凡事在社群同学,可免费获得自2021年11月份至今全部教程,教程配备事例数据和相关代码,我们会持续更新中。
❞
往期教程部分内容


关于hdWGCNA
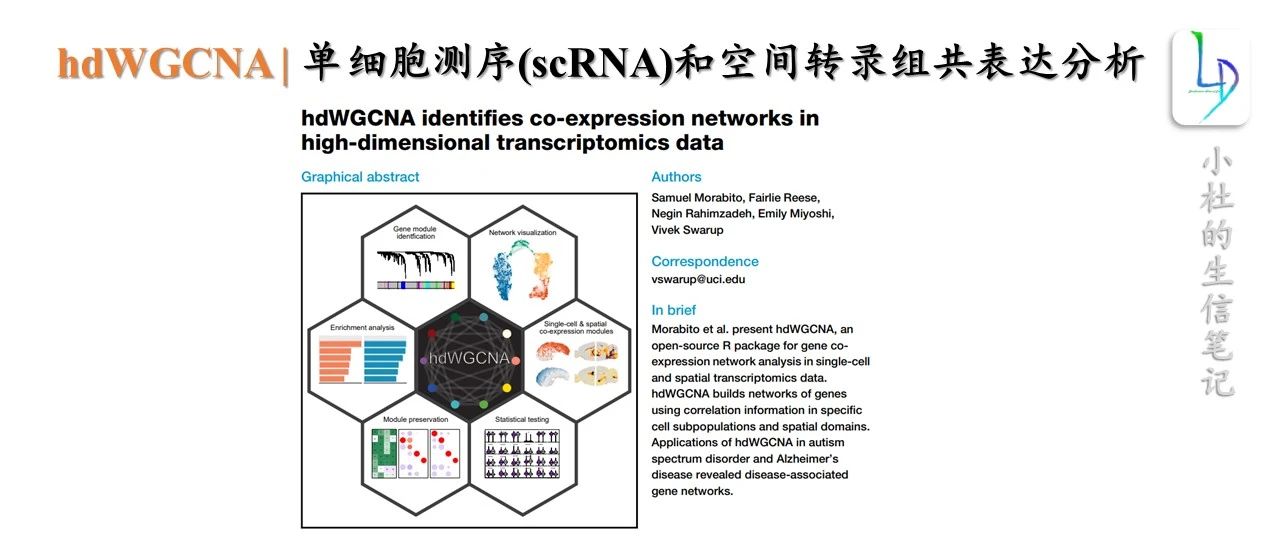
hdWGCNA (high dimensional WGCNA,高纬度WGCNA),用于单细胞RNA-seq或空间转录组学等高维转录组学数据中执行加权基因共表达网络分析。
详情查看:https://smorabit.github.io/hdWGCNA/articles/basic_tutorial.html
hdWGCNA包
https://github.com/smorabit/hdWGCNA

下载所需数据
# wget https://swaruplab.bio.uci.edu/public_data/Zhou_2020.rds
Load the dataset and required librarie
# single-cell analysis package
library(Seurat)

# plotting and data science packages
library(tidyverse)
library(cowplot)
library(patchwork)

# co-expression network analysis packages:
library(WGCNA)
#devtools::install_github('smorabit/hdWGCNA', ref='dev')
library(hdWGCNA)

# using the cowplot theme for ggplot
theme_set(theme_cowplot())

# set random seed for reproducibility
set.seed(12345)

# optionally enable multithreading
enableWGCNAThreads(nThreads = 8)

# load the Zhou et al snRNA-seq dataset
seurat_obj <- readRDS('Zhou_2020.rds')

seurat_obj <- readRDS("C:\\sfotware\\R-4.3.2\\library\\hdWGCNA\\data\\Rdata.rds")
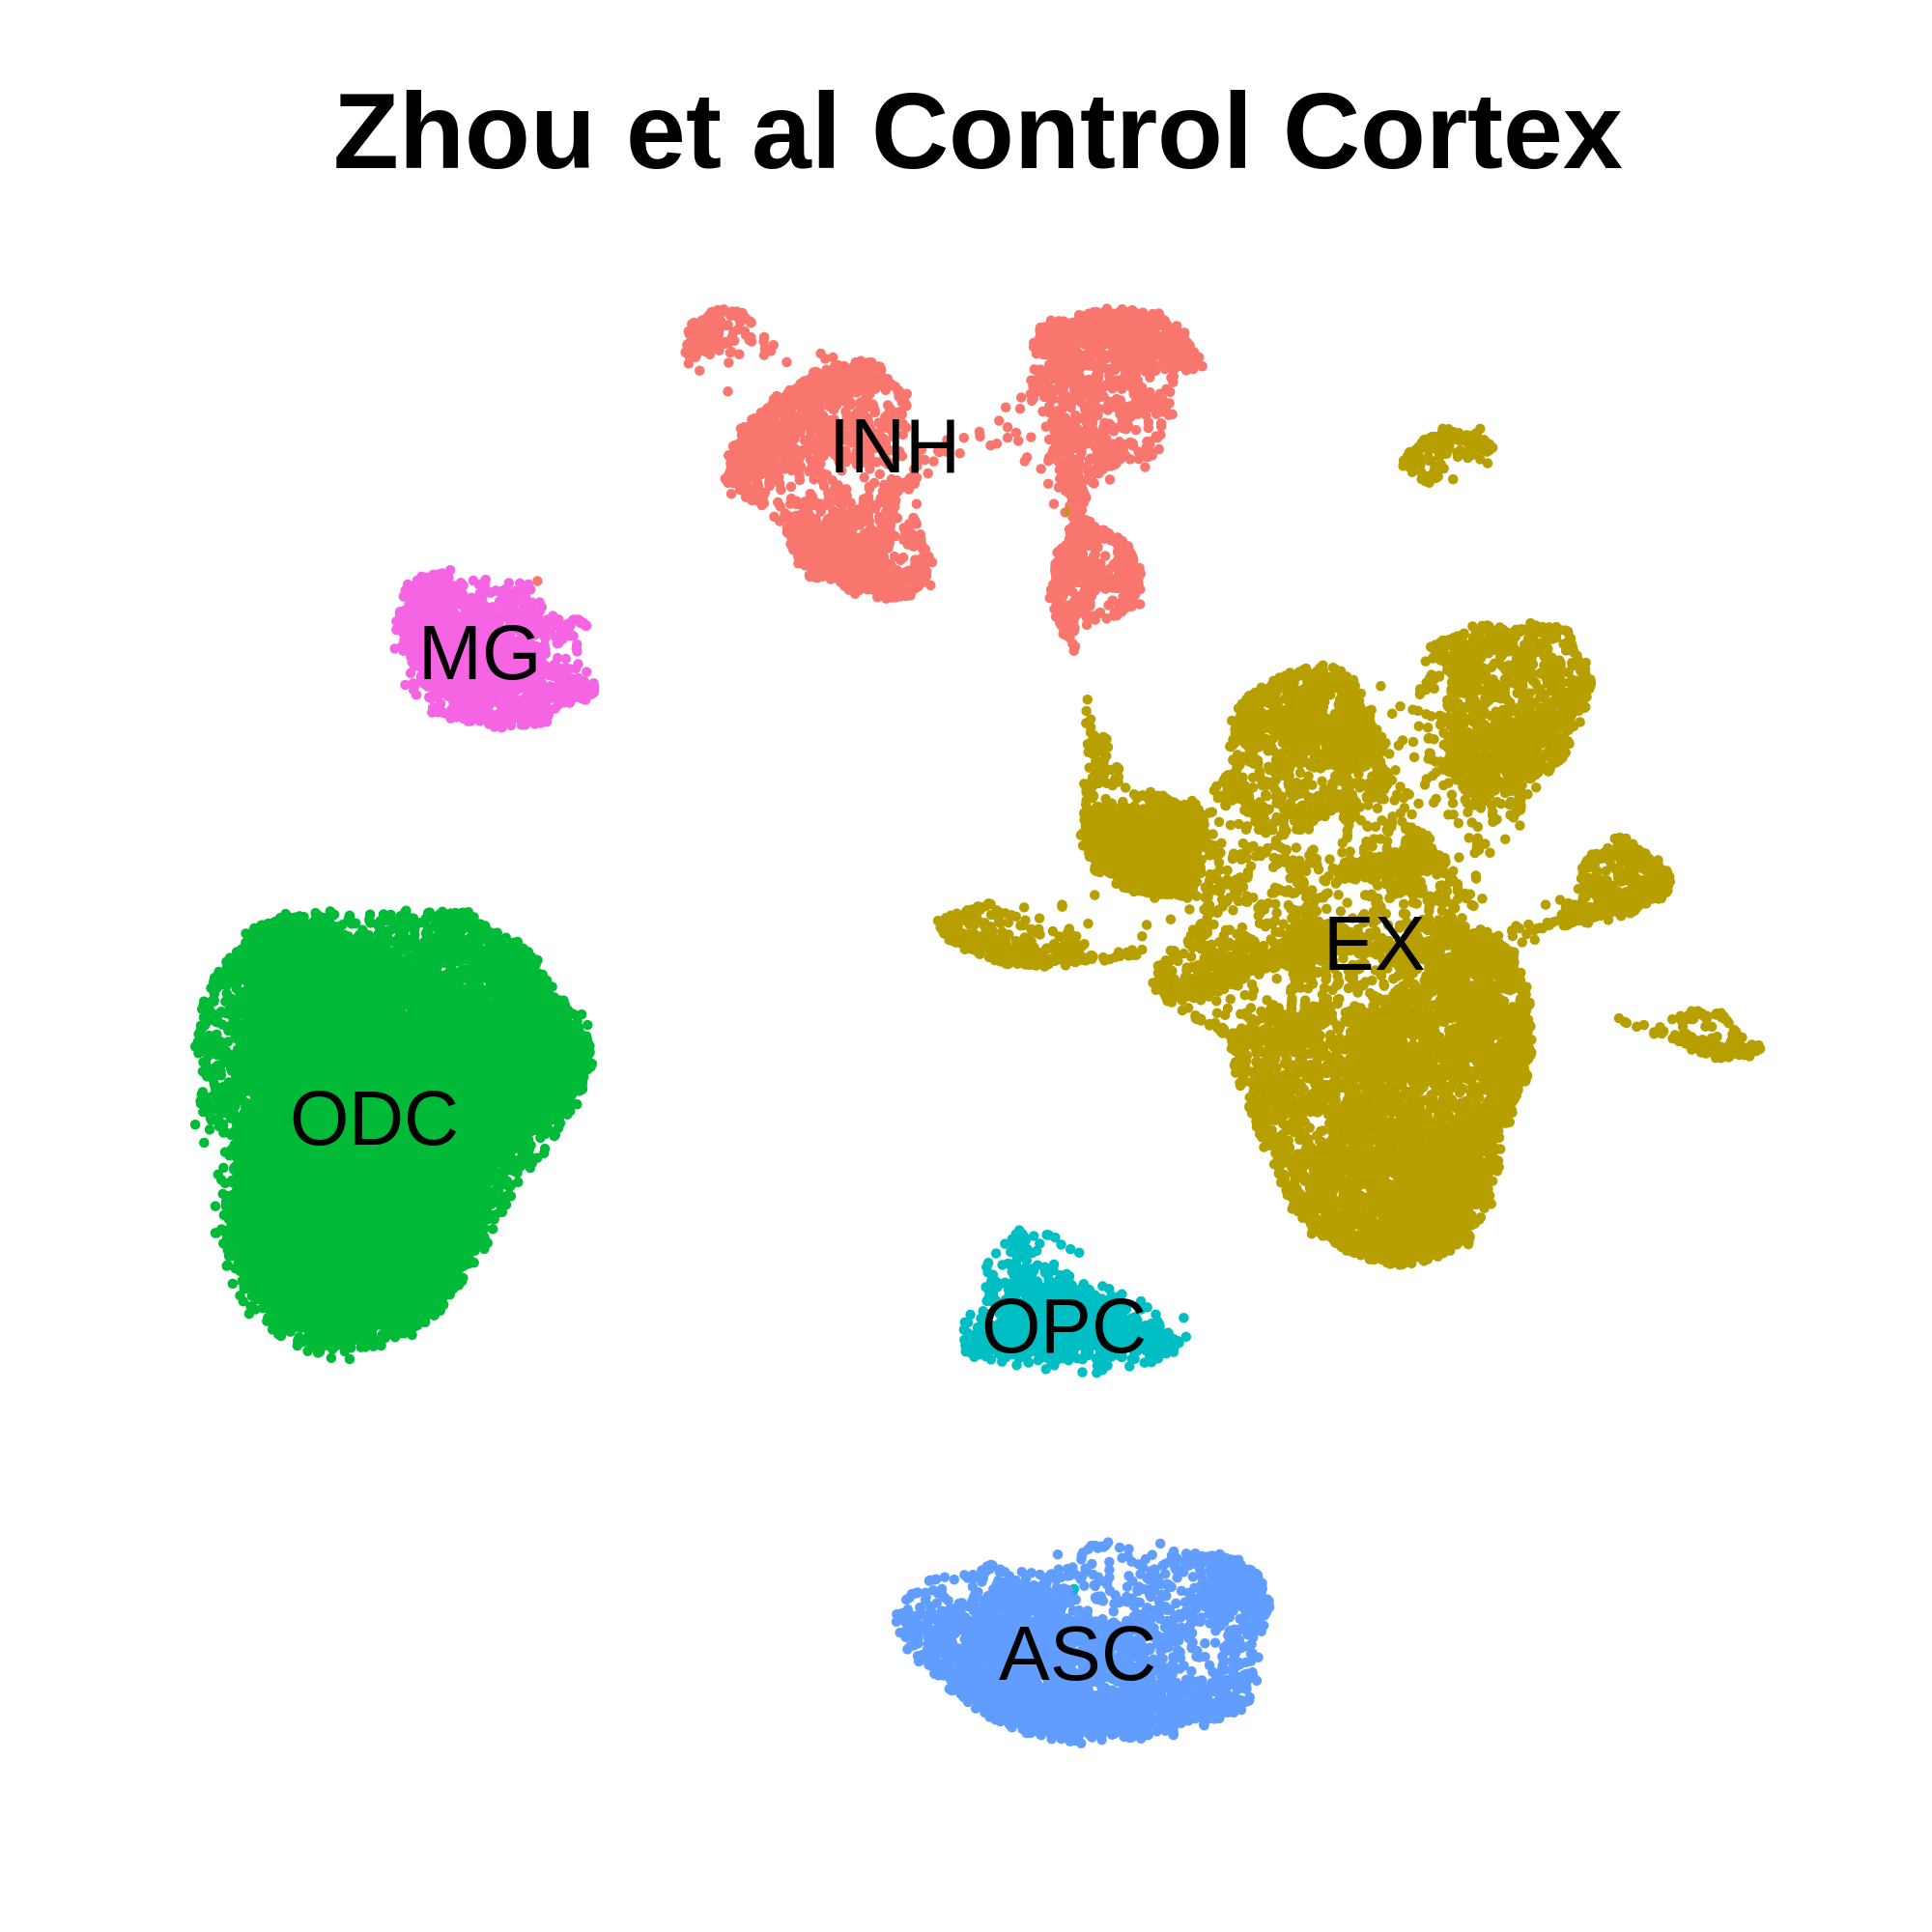
绘制按细胞类型着色的 UMAP 图,以检查我们是否正确加载了数据,并确保我们已将细胞归入细胞群和细胞类型。
p <- DimPlot(seurat_obj, group.by='cell_type', label=TRUE) +
   umap_theme() + ggtitle('Zhou et al Control Cortex') + NoLegend()

p

设置Seurat对象
在运行 hdWGCNA 之前,我们首先要设置 Seurat 对象。hdWGCNA 计算出的大部分信息都存储在 Seurat 对象的 @misc 插槽中。一个 Seurat 对象可以容纳多个 hdWGCNA 实验,例如代表同一单细胞数据集中的不同细胞类型。值得注意的是,由于我们将hdWGCNA 视为下游数据分析步骤,因此不支持在运行 SetupForWGCNA 之后对 Seurat 对象进行子集化。
在此,我们将使用SetupForWGCNA函数设置Seurat对象,并指定hdWGNCA实验的名称。该函数还将选择用于WGCNA的基因。用户可以使用 gene_select 参数用三种不同的方法选择基因:
- variable:使用存储在Seurat对象VariableFeatures中的基因。
- fraction:使用由group.by指定的在整个数据集或每组细胞中某一部分表达的基因。 自定义:使用自定义列表中指定的基因。
- custom:使用自定义列表中指定的基因。
seurat_obj <- SetupForWGCNA(
  seurat_obj,
  gene_select = "fraction", # the gene selection approach
  fraction = 0.05, # fraction of cells that a gene needs to be expressed in order to be included
  wgcna_name = "tutorial"# the name of the hdWGCNA experiment
)
Construct metacells
设置好 Seurat 对象后,在 hdWGCNA 中运行 hdWGCNA pipeine 的第一步就是根据单细胞数据集构建元胞。简而言之,元细胞是由来源于同一生物样本的小群相似细胞组成的集合体。使用k-Nearest Neighbors(KNN)算法来识别需要聚合的相似细胞群,然后计算这些细胞的平均或总和表达量,从而得到元细胞基因表达矩阵。与原始表达矩阵相比,元胞表达矩阵的稀疏性大大降低,因此更适合使用。我们使用元胞代替原始单细胞的最初动机是,相关网络方法(如 WGCNA)对数据稀疏性很敏感。
# construct metacells  in each group
seurat_obj <- MetacellsByGroups(
  seurat_obj = seurat_obj,
  group.by = c("cell_type", "Sample"), # specify the columns in [email]seurat_obj@meta.data[/email] to group by
  reduction = 'harmony', # select the dimensionality reduction to perform KNN on
  k = 25, # nearest-neighbors parameter
  max_shared = 10, # maximum number of shared cells between two metacells
  ident.group = 'cell_type'# set the Idents of the metacell seurat object
)

# normalize metacell expression matrix:
seurat_obj <- NormalizeMetacells(seurat_obj)
Co-expression network analysis
Set up the expression matrix
在这里,要指定用于网络分析的表达矩阵。hdWGCNA包含SetDatExpr函数,用于存储用于下游网络分析的给定细胞组的转置表达矩阵。默认情况下使用元细胞表达矩阵(use_metacells=TRUE),但如果需要,hdWGCNA也允许使用单细胞表达矩阵。该函数允许用户指定从哪个槽获取表达矩阵,例如,如果用户想应用SCTransform归一化而不是NormalizeData。
seurat_obj <- SetDatExpr(
  seurat_obj,
  group_name = "INH", # the name of the group of interest in the group.by column
  group.by='cell_type', # the metadata column containing the cell type info. This same column should have also been used in MetacellsByGroups
  assay = 'RNA', # using RNA assay
  slot = 'data'# using normalized data
)
Select soft-power threshold
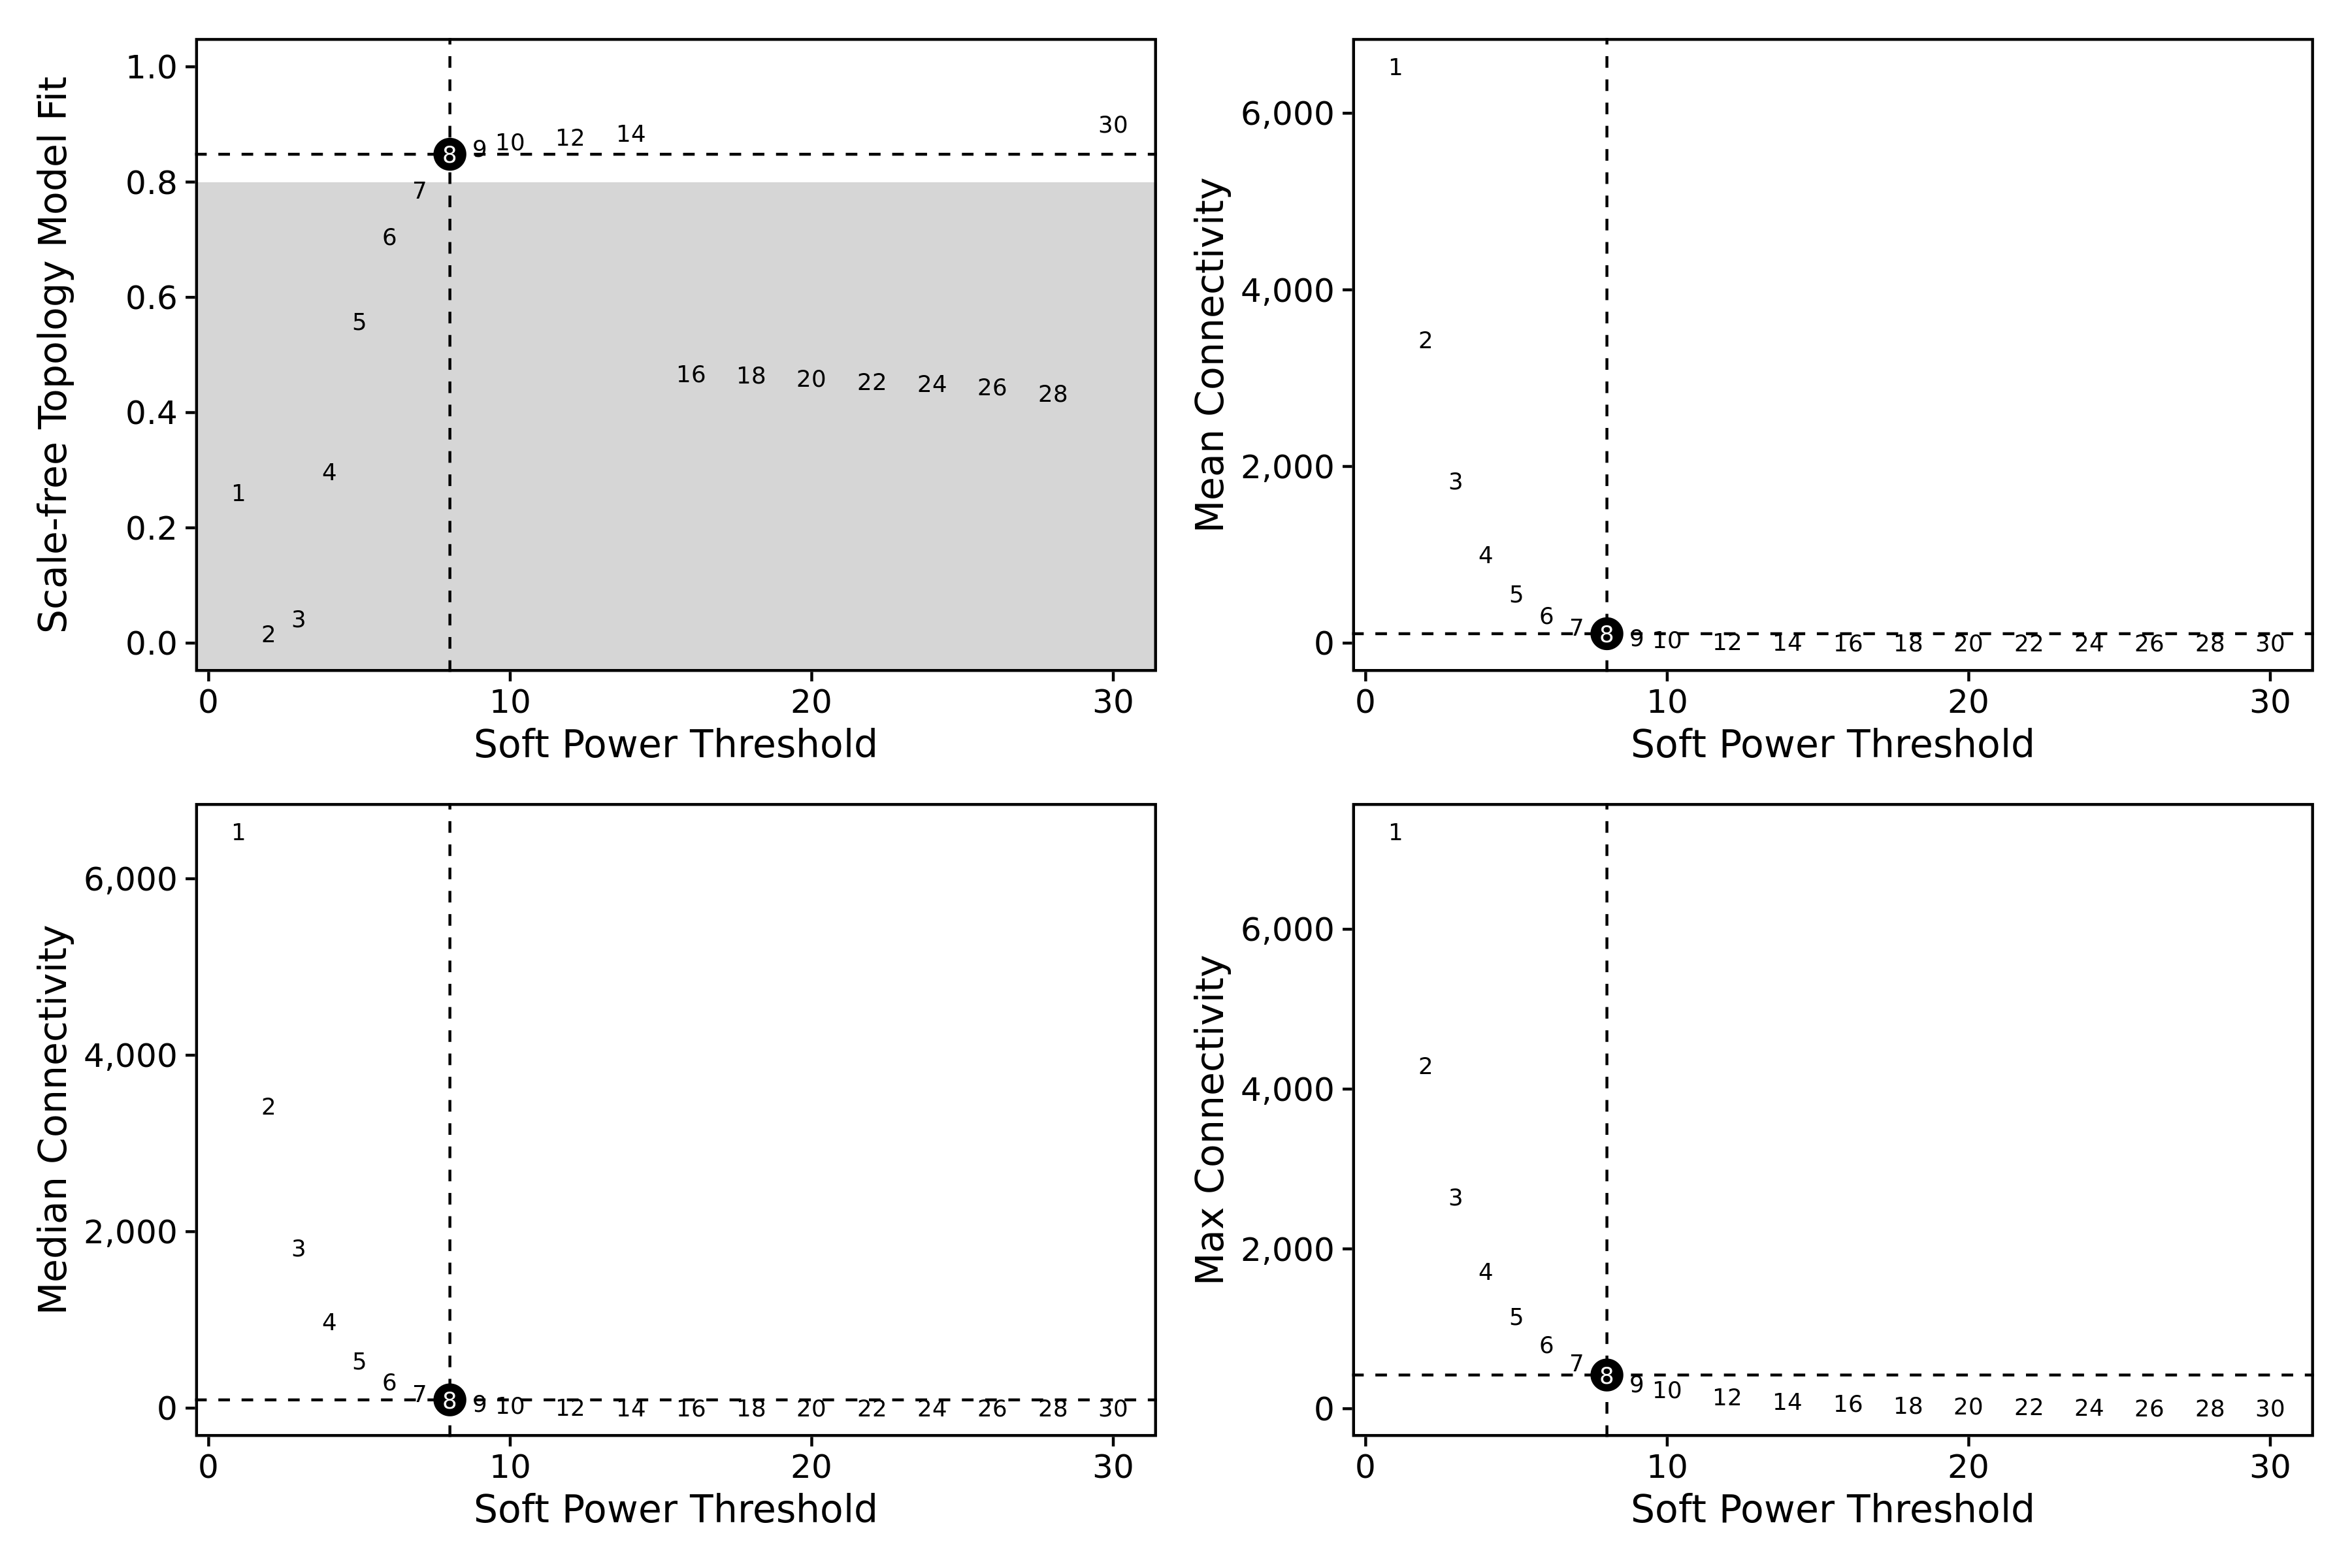
选择 "soft power threshold值"。hdWGCNA构建了一个基因-基因相关性邻接矩阵,以推断基因之间的共表达关系。相关性被提升到一个幂次,以减少相关性矩阵中存在的噪声,从而保留强连接,去除弱连接。因此,确定一个合适的软幂阈值至关重要。
提供了一个TestSoftPowers函数,用于对不同的软功率阈值进行参数扫描。该函数通过检测不同功率值下的网络拓扑结构,帮助我们选择构建共表达网络的软功率阈值。共表达网络应该具有无标度拓扑结构,因此TestSoftPowers函数模拟了在不同软实力阈值下,共表达网络与无标度图的相似程度。
# Test different soft powers:
seurat_obj <- TestSoftPowers(
  seurat_obj,
  networkType = 'signed'# you can also use "unsigned" or "signed hybrid"
)

# plot the results:
plot_list <- PlotSoftPowers(seurat_obj)

# assemble with patchwork
wrap_plots(plot_list, ncol=2)

Construct co-expression network
# construct co-expression network:
seurat_obj <- ConstructNetwork(
  seurat_obj,
  tom_name = 'INH'# name of the topoligical overlap matrix written to disk
)
PlotDendrogram(seurat_obj, main='INH hdWGCNA Dendrogram')

Compute module connectivity
# compute eigengene-based connectivity (kME):
seurat_obj <- ModuleConnectivity(
  seurat_obj,
  group.by = 'cell_type', group_name = 'INH'
)


# rename the modules
seurat_obj <- ResetModuleNames(
  seurat_obj,
  new_name = "INH-M"
)
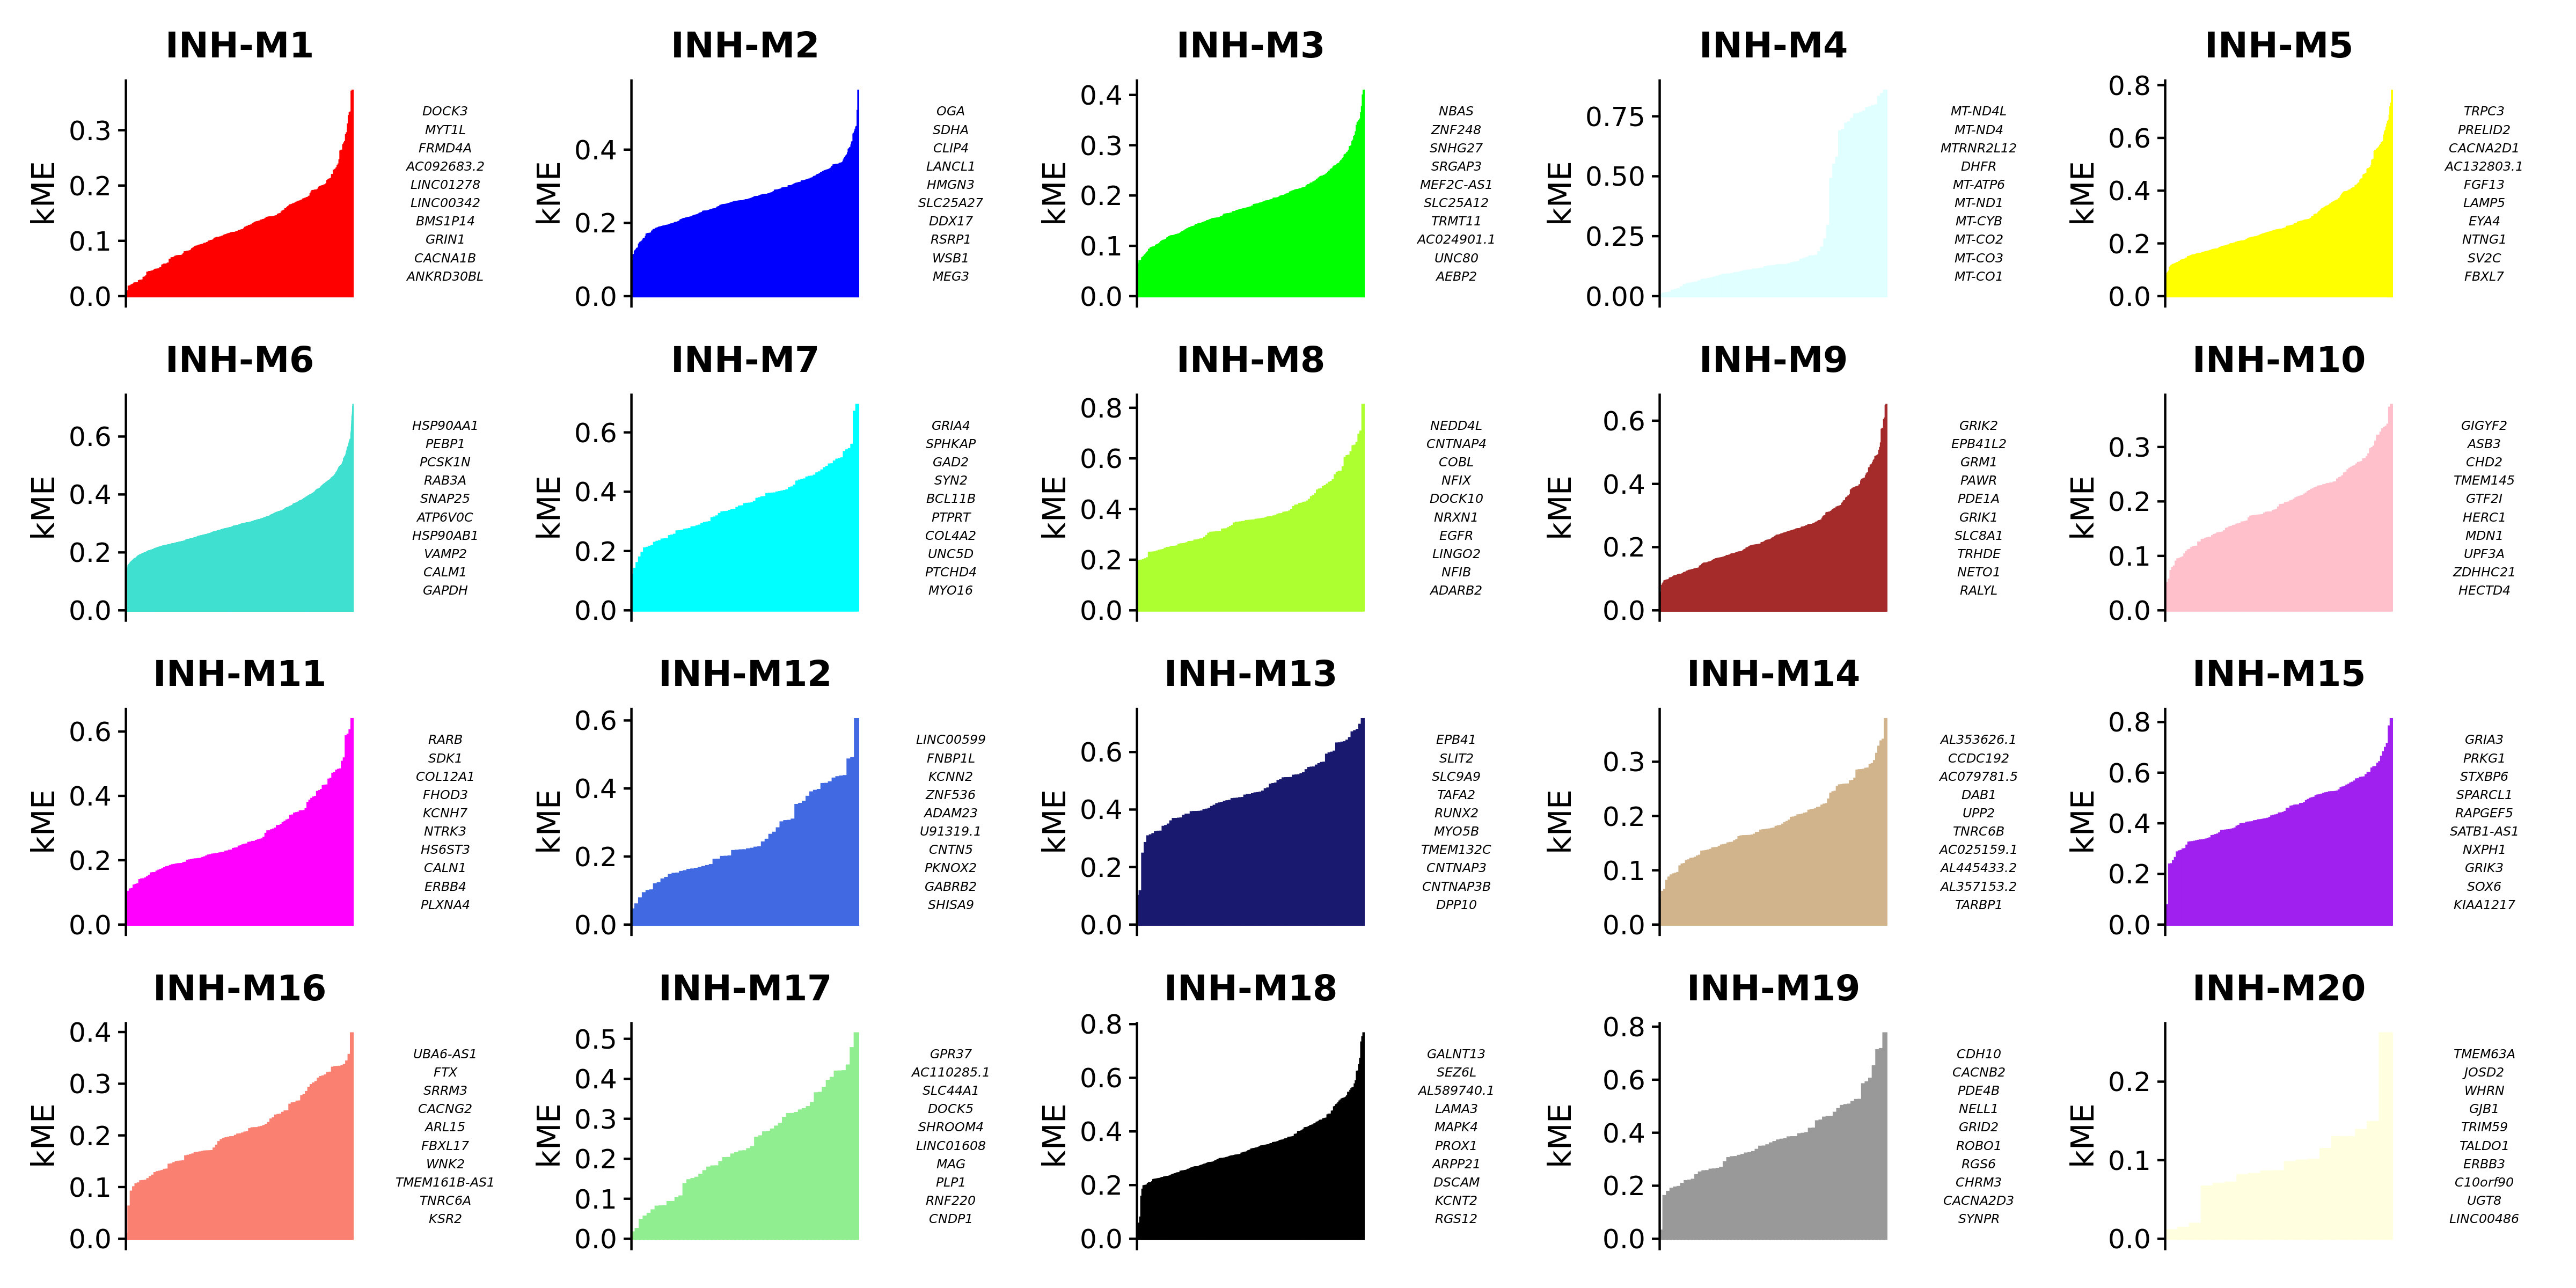
# plot genes ranked by kME for each module
p <- PlotKMEs(seurat_obj, ncol=5)

p

Module Feature Plots
FeaturePlot is a commonly used Seurat visualization to show a feature of interest directly on the dimensionality reduction. hdWGCNA includes the ModuleFeaturePlot function to consruct FeaturePlots for each co-expression module colored by each module’s uniquely assigned color.
# make a featureplot of hMEs for each module
plot_list <- ModuleFeaturePlot(
  seurat_obj,
  features='hMEs', # plot the hMEs
  order=TRUE# order so the points with highest hMEs are on top
)

# stitch together with patchwork
wrap_plots(plot_list, ncol=6)

获得本期教程文本教程,「回复关键词」:**20240520**
❝
若我们的教程对你有所帮助,请点赞+收藏+转发,这是对我们最大的支持。
❞
往期部分文章
「1. 最全WGCNA教程(替换数据即可出全部结果与图形)」
「2. 精美图形绘制教程」
「3. 转录组分析教程」
「4. 转录组下游分析」
「小杜的生信筆記」 ,主要发表或收录生物信息学教程,以及基于R分析和可视化(包括数据分析,图形绘制等);分享感兴趣的文献和学习资料!!