本期教程
 多因素独立预后
在社群中可获得本期教程全部代码和示例数据❞
写在前面
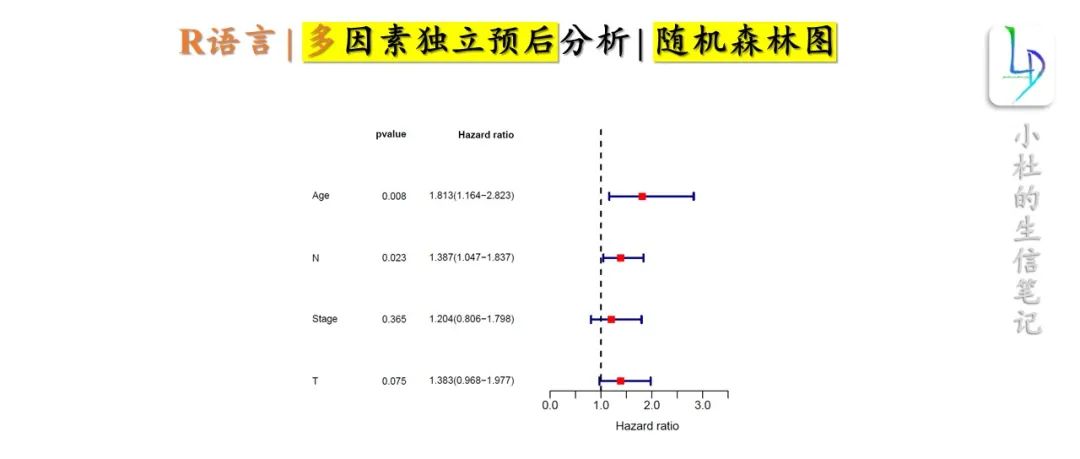
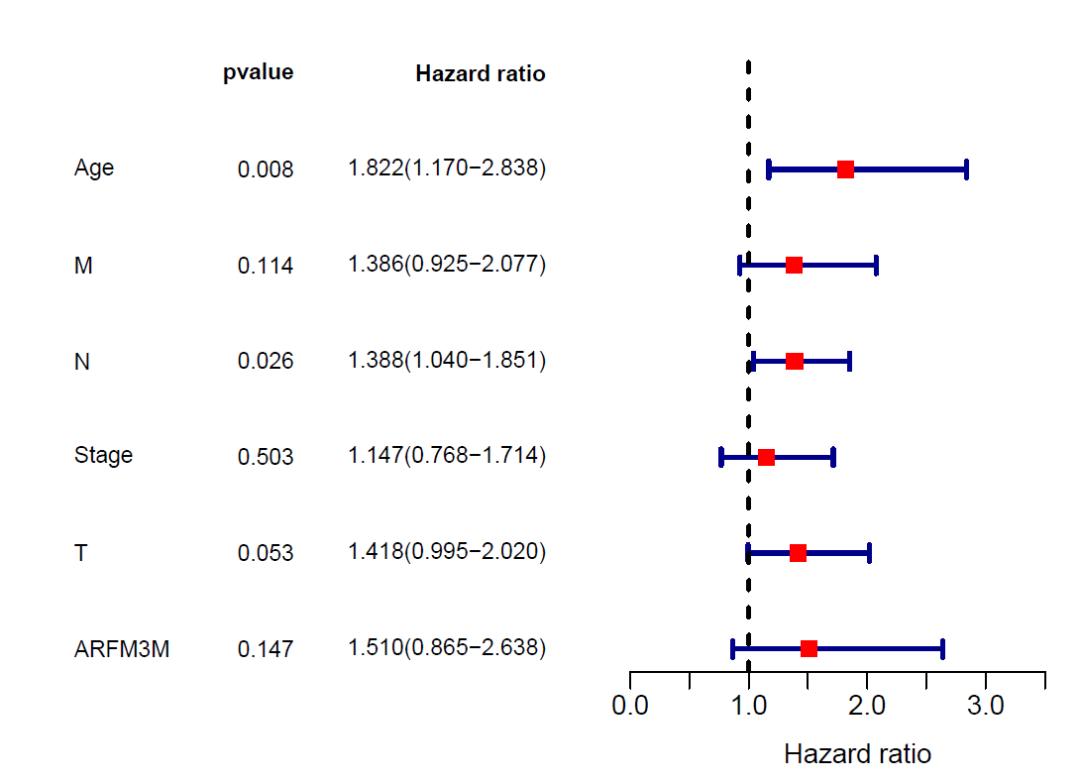
我们上一个教程做了单因素独立预后分析,今天的教程基于单因素独立预后分析结果,做「多因素独立预后分析」。分析原理:基于单因素Cox分析结果,我们对P值小0.05的临床分期进行多因素Cox独立预后分析。
往期教程部分内容


分析代码
# 多因素独立预后分析
input <- read.csv("ARFM3M_input_data.csv", header = T)
head(input)
dim(input)
##'@单因素Cox结果
rt <- read.csv("unoCox_result.csv", header = T, row.names = 1)
head(rt)
rt1 <- input[,c("sample","futime", "fustat", rownames(rt[rt$pvalue < 0.05,]))]  ##根据单因素分析,筛选出p值小于0.05的因素,P值大小可结合自己需求设置,继续分析
head(rt1)
dim(rt1)
write.csv(rt1, "multi.cox.input.csv", row.names = F)
分析
rt <- read.csv("multi.cox.input.csv", header = T, row.names = 1)

##'@年龄大于65分组为2,小于设置1
rt$Age = ifelse(rt$Age >= 65,2,1)
##'@创建模型
multiCox=coxph(Surv(futime, fustat) ~ ., data = rt)
multiCoxSum=summary(multiCox)
##
outTab=data.frame()
outTab=cbind(
  HR=multiCoxSum$conf.int[,"exp(coef)"],
  HR.95L=multiCoxSum$conf.int[,"lower .95"],
  HR.95H=multiCoxSum$conf.int[,"upper .95"],
  pvalue=multiCoxSum$coefficients[,"Pr(>|z|)"])
outTab=cbind(id=row.names(outTab),outTab)
##'@保存结果
outTab
write.csv(outTab,file="multiCox_result.csv",row.names=F)
id  HR  HR.95L  HR.95H  pvalue
Age 1.8220090221.1698349162.8377652520.007957913
M   1.3858823010.9248583622.0767177240.113781591
N   1.3875005221.040098971.8509370280.025923837
Stage   1.1471839050.7677170711.7142134270.502823866
T1.417666780.9947762172.0203328790.053484719
ARFM3M  1.5104725470.8649405452.6377851380.14709173
##'@重新导入结果
rt <- read.csv("multiCox_result.csv", header = T, row.names = 1)
##
gene <- rownames(rt)
hr <- sprintf("%.3f",rt$"HR")
hrLow  <- sprintf("%.3f",rt$"HR.95L")
hrHigh <- sprintf("%.3f",rt$"HR.95H")
Hazard.ratio <- paste0(hr,"(",hrLow,"-",hrHigh,")")
pVal <- ifelse(rt$pvalue<0.001, "<0.001", sprintf("%.3f", rt$pvalue))

#'@绘制随机森林图
pdf(file="multi.forest.pdf", width = 7,height = 5)
n <- nrow(rt)
nRow <- n+1
ylim <- c(1,nRow)
layout(matrix(c(1,2),nc=2),width=c(3,2.5))

#绘制森林图左边的临床信息
xlim = c(0,3)
par(mar=c(4,2.5,2,1))
plot(1,xlim=xlim,ylim=ylim,type="n",axes=F,xlab="",ylab="")
text.cex=0.8
text(0,n:1,gene,adj=0,cex=text.cex)
text(1.5-0.5*0.2,n:1,pVal,adj=1,cex=text.cex);text(1.5-0.5*0.2,n+1,'pvalue',cex=text.cex,font=2,adj=1)
text(3,n:1,Hazard.ratio,adj=1,cex=text.cex);text(3,n+1,'Hazard ratio',cex=text.cex,font=2,adj=1,)

#绘制森林图
par(mar=c(4,1,2,1),mgp=c(2,0.5,0))
xlim = c(0,max(as.numeric(hrLow),as.numeric(hrHigh)+1))
plot(1,xlim=xlim,ylim=ylim,type="n",axes=F,ylab="",xaxs="i",xlab="Hazard ratio")
arrows(as.numeric(hrLow),n:1,as.numeric(hrHigh),n:1,angle=90,code=3,length=0.05,col="darkblue",lwd=2.5)
abline(v=1,col="black",lty=2,lwd=2)
boxcolor = ifelse(as.numeric(hr) > 1, 'red', 'green')
points(as.numeric(hr), n:1, pch = 15, col = boxcolor, cex=1.3)
axis(1)

dev.off()

在社群中可获得本期教程全部代码和示例数据❞
若我们的教程对你有所帮助,请 点赞+收藏+转发,这是对我们最大的支持。❞
往期部分文章
「1. 最全WGCNA教程(替换数据即可出全部结果与图形)」
「2. 精美图形绘制教程」
「3. 转录组分析教程」
「4. 转录组下游分析」
「小杜的生信筆記」 ,主要发表或收录生物信息学教程,以及基于R分析和可视化(包括数据分析,图形绘制等);分享感兴趣的文献和学习资料!!