原文教程:R语言绘图 | 复杂Upset绘制教程

关于《R语言绘图专栏》
关于《R语言绘图专栏》,此专栏基于 R语言绘制图形。每个图形我们会提供对应的 R代码、数据和 文本文档。此系列将会是一个长期更新的系列。
注意:若是你加入我们社群,则直接在社群中获得。
本期教程
获得本教程 Data and Code,请在后台回复:20240815。
2022年教程总汇

2023年教程总汇

Code
- 加载对应的R包
#install.packages('ComplexUpset')
#install.packages("ggplot2movies")

library(ComplexUpset)
library(ggplot2)
library(ggplot2movies)
- 创建数据
movies = as.data.frame(ggplot2movies::movies)
head(movies, 3)
> head(movies, 3)
                   title year length budget rating votes  r1   r2  r3   r4   r5   r6
1                      $ 1971    121     NA    6.4   348 4.5  4.5 4.5  4.5 14.5 24.5
2      $1000 a Touchdown 1939     71     NA    6.0    20 0.0 14.5 4.5 24.5 14.5 14.5
3 $21 a Day Once a Month 1941      7     NA    8.2     5 0.0  0.0 0.0  0.0  0.0 24.5
    r7   r8   r9  r10 mpaa Action Animation Comedy Drama Documentary Romance Short
1 24.5 14.5  4.5  4.5           0         0      1     1           0       0     0
2 14.5  4.5  4.5 14.5           0         0      1     0           0       0     0
3  0.0 44.5 24.5 24.5           0         1      0     0           0       0     1
- 数据处理
##'@提取对应的数据
genres = colnames(movies)[18:24]
genres

movies[genres] = movies[genres] == 1
t(head(movies[genres], 3))


movies[movies$mpaa == '', 'mpaa'] = NA
movies = na.omit(movies)
head(movies)

set_size = function(w, h, factor=1.5) {
  s = 1 * factor
  options(
    repr.plot.width=w * s,
    repr.plot.height=h * s,
    repr.plot.res=100 / factor,
    jupyter.plot_mimetypes='image/png',
    jupyter.plot_scale=1
  )
}
- 绘制基础图形
set_size(8, 3)
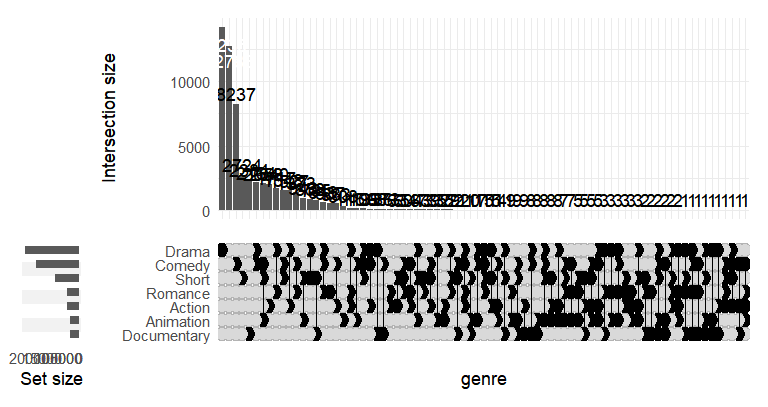
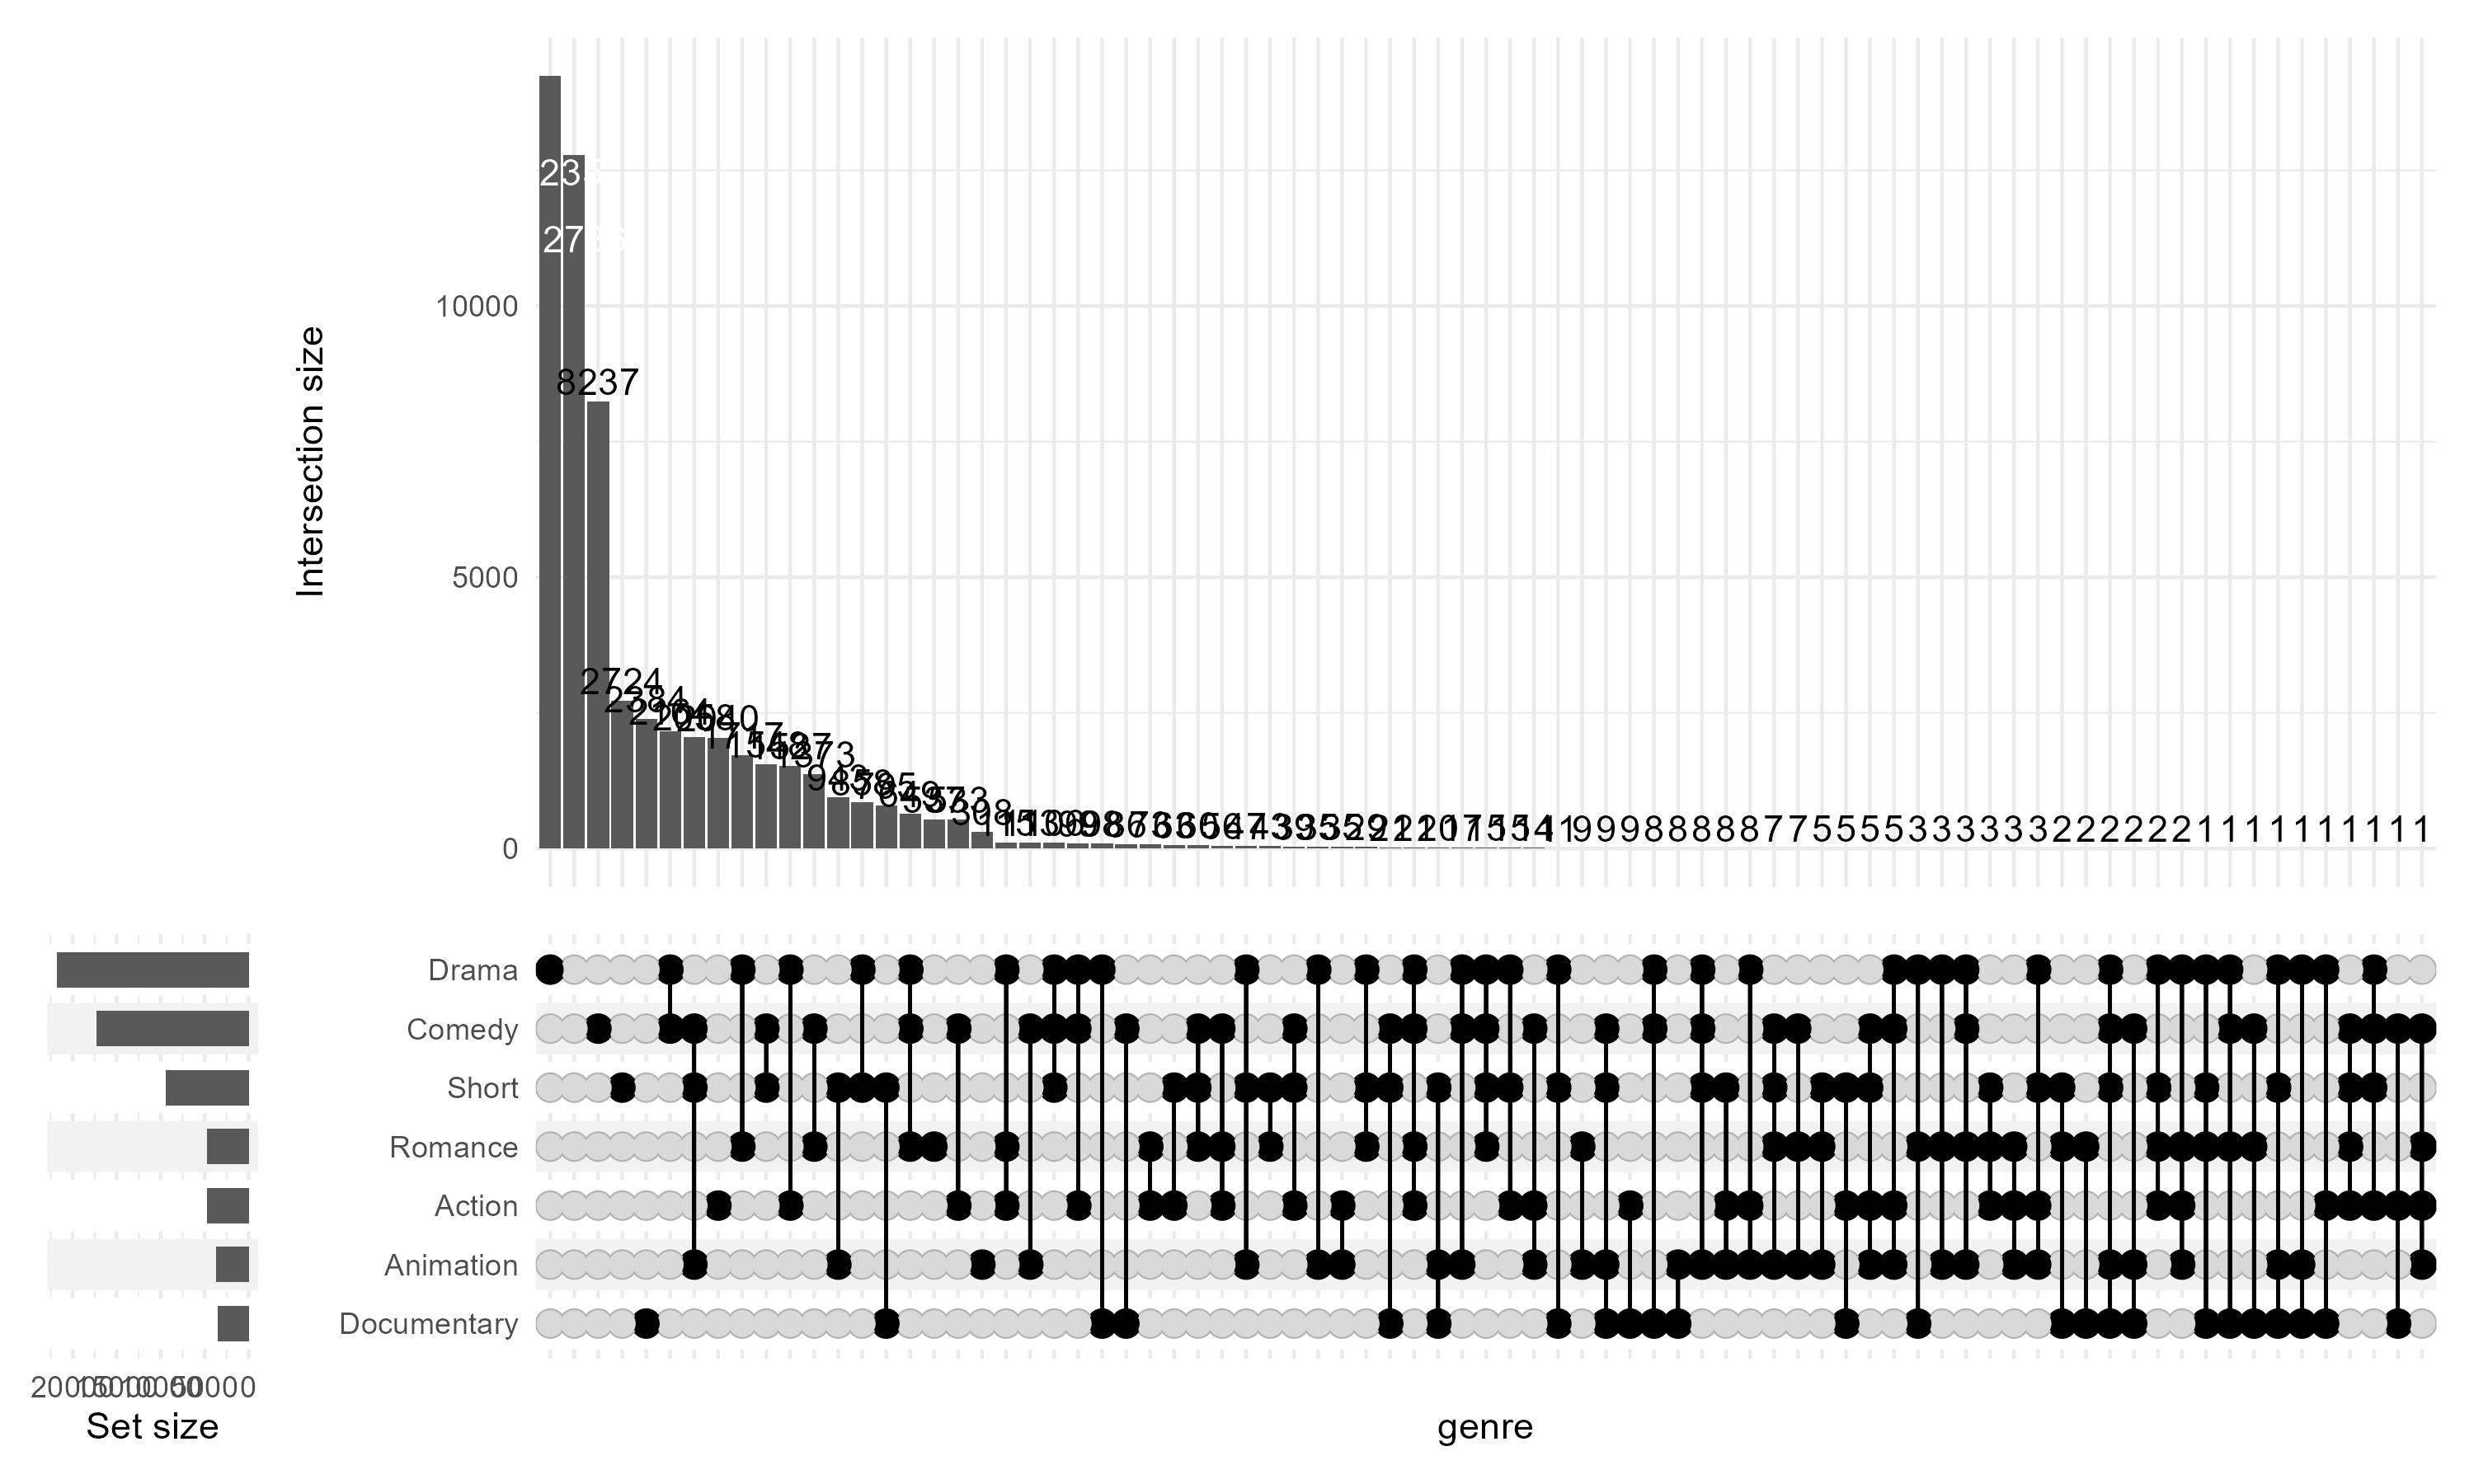
upset(movies, genres, name='genre', width_ratio=0.1)
- 绘制维恩图
abc_data = create_upset_abc_example()

abc_venn = (
  ggplot(arrange_venn(abc_data))
  + coord_fixed()
  + theme_void()
  + scale_color_venn_mix(abc_data)
)

(
  abc_venn
  + geom_venn_region(data=abc_data, alpha=0.05)
  + geom_point(aes(x=x, y=y, color=region), size=1)
  + geom_venn_circle(abc_data)
  + geom_venn_label_set(abc_data, aes(label=region))
  + geom_venn_label_region(
    abc_data, aes(label=size),
    outwards_adjust=1.75,
    position=position_nudge(y=0.2)
  )
  + scale_fill_venn_mix(abc_data, guide='none')
)

- 绘制复杂维恩图
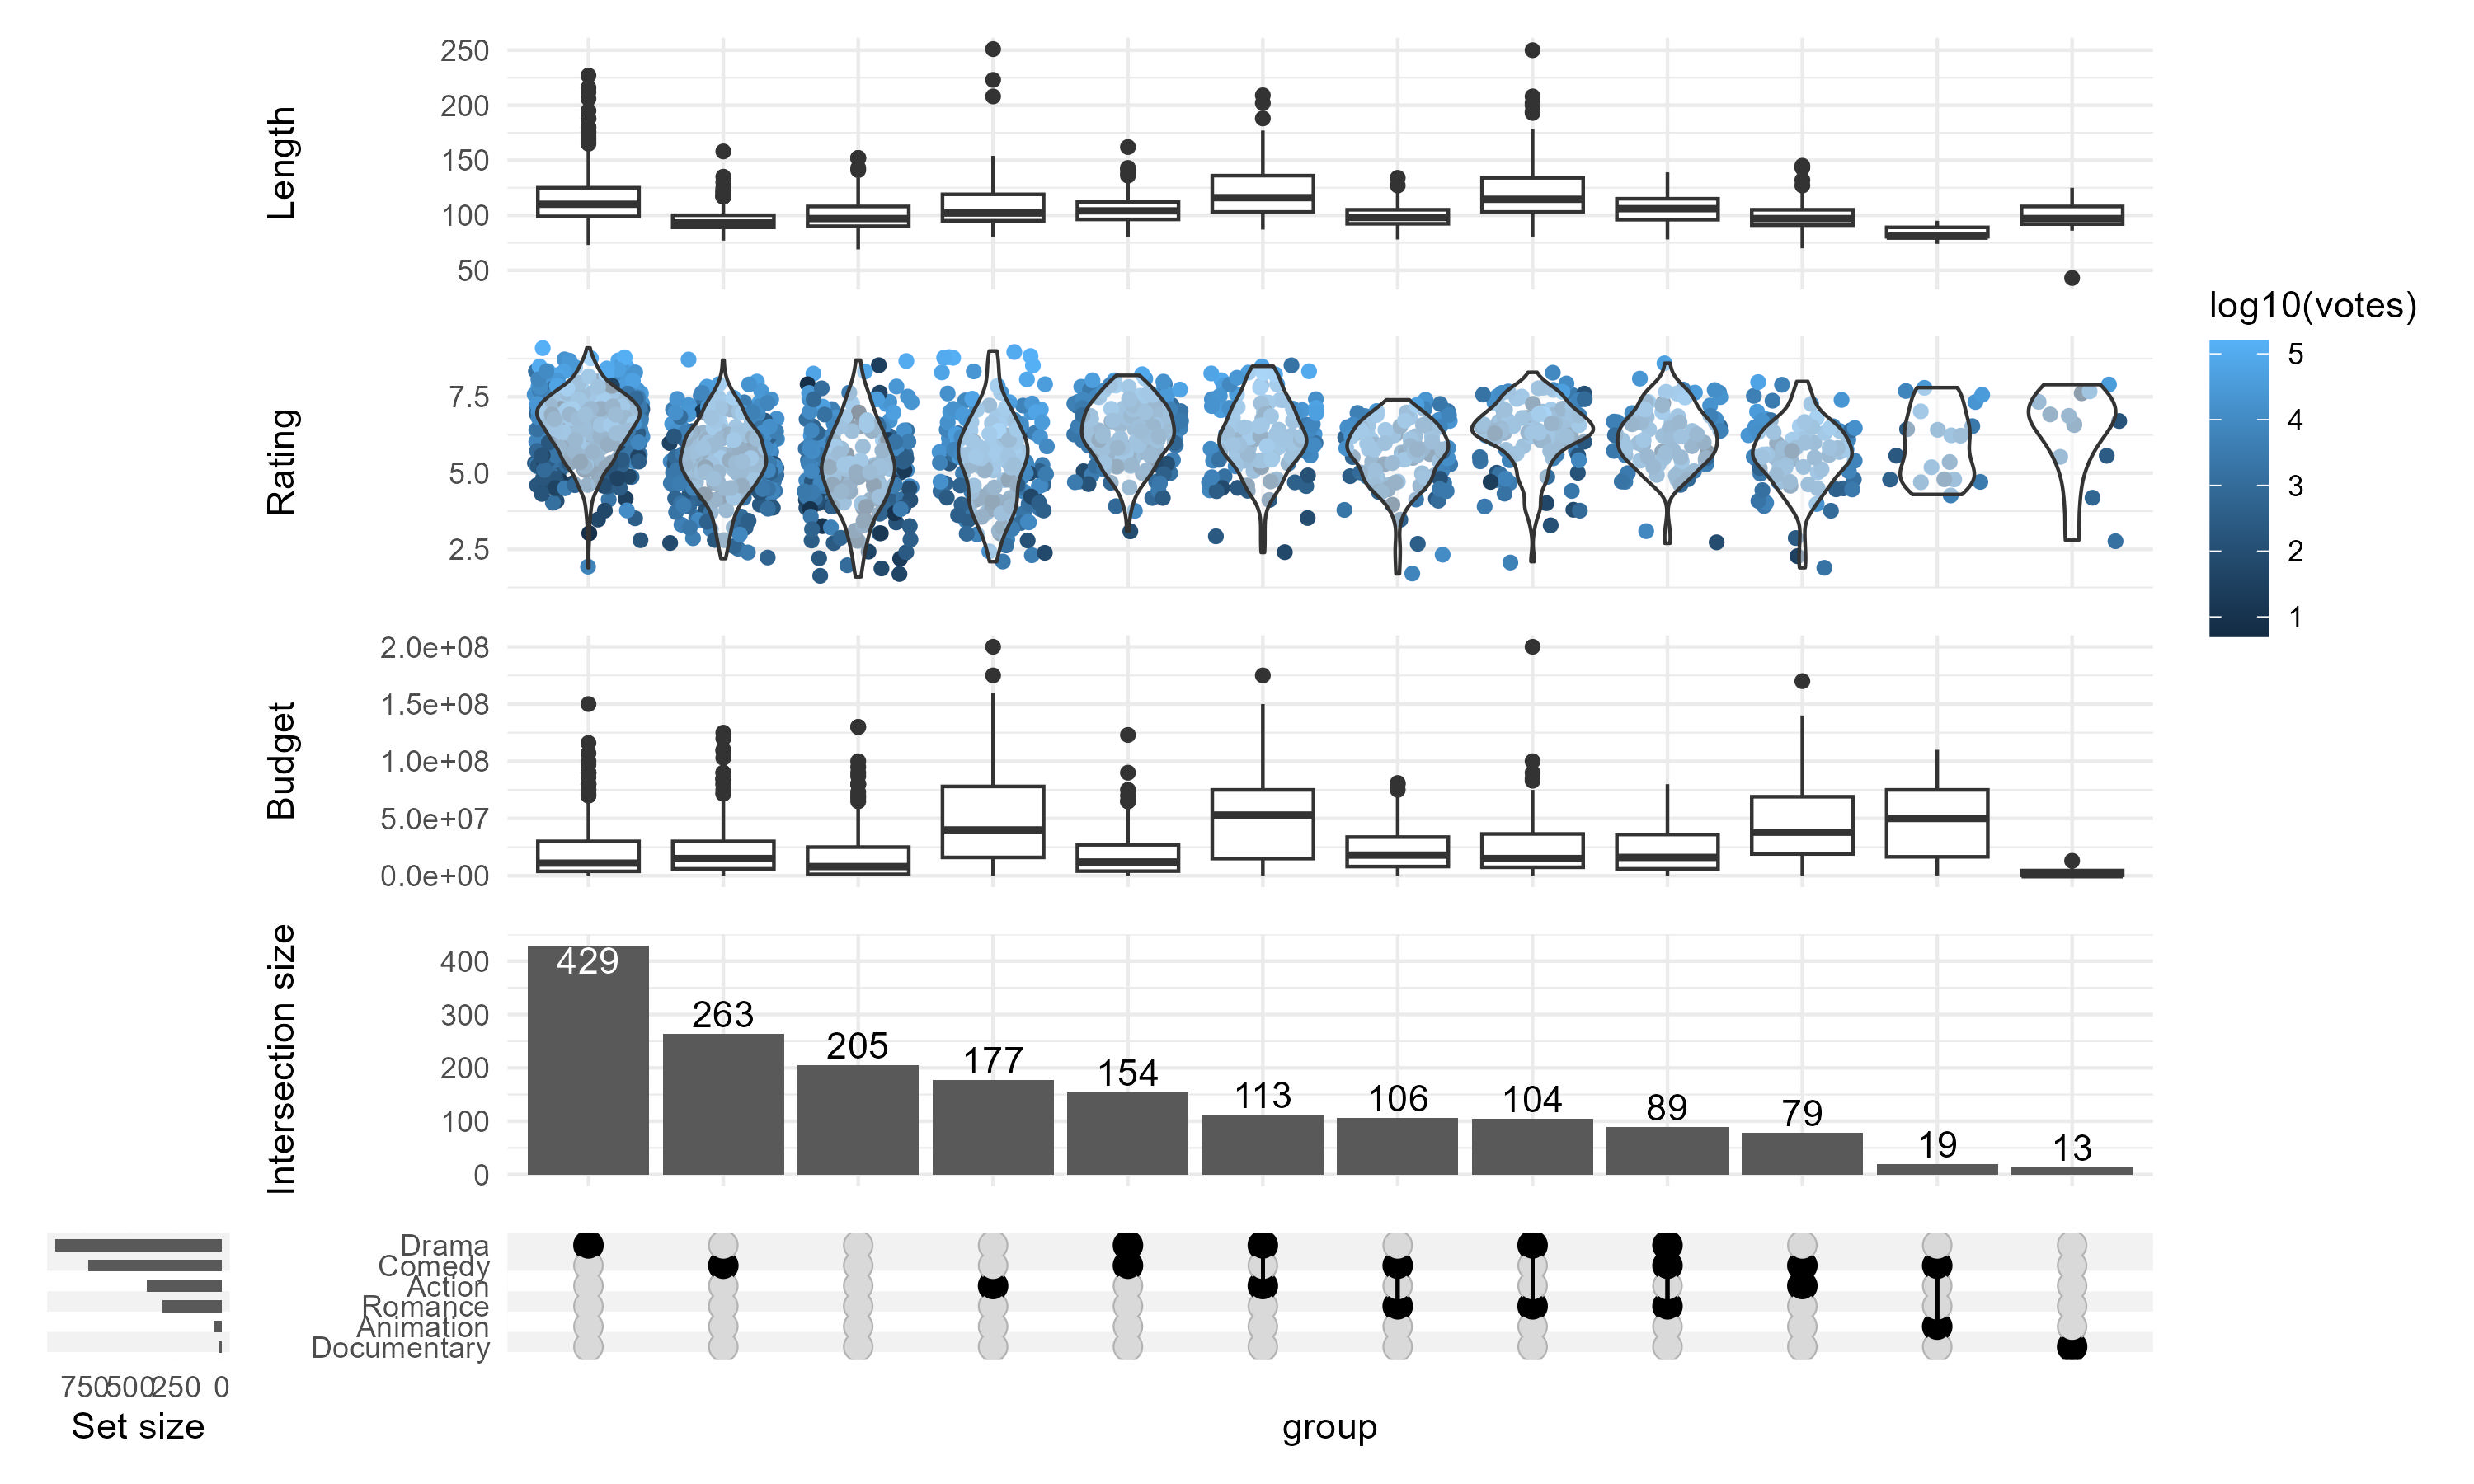
set_size(8, 8)

set.seed(0)   # keep the same jitter for identical plots

upset(
  movies,
  genres,
  annotations = list(
    # 1st method - passing list:
    'Length'=list(
      aes=aes(x=intersection, y=length),
      # provide a list if you wish to add several geoms
      geom=geom_boxplot(na.rm=TRUE)
    ),
    # 2nd method - using ggplot
    'Rating'=(
      # note that aes(x=intersection) is supplied by default and can be skipped
      ggplot(mapping=aes(y=rating))
      # checkout ggbeeswarm::geom_quasirandom for better results!
      + geom_jitter(aes(color=log10(votes)), na.rm=TRUE)
      + geom_violin(alpha=0.5, na.rm=TRUE)
    ),
    # 3rd method - using `upset_annotate` shorthand
    'Budget'=upset_annotate('budget', geom_boxplot(na.rm=TRUE))
  ),
  min_size=10,
  width_ratio=0.1
)
- 比例Upset
##'@绘制比例Upset图
set_size(8, 5)

upset(
  movies,
  genres,
  annotations = list(
    'MPAA Rating'=(
      ggplot(mapping=aes(fill=mpaa))
      + geom_bar(stat='count', position='fill')
      + scale_y_continuous(labels=scales::percent_format())
      + scale_fill_manual(values=c(
        'R'='#E41A1C', 'PG'='#377EB8',
        'PG-13'='#4DAF4A', 'NC-17'='#FF7F00'
      ))
      + ylab('MPAA Rating')
    )
  ),
  width_ratio=0.1
)

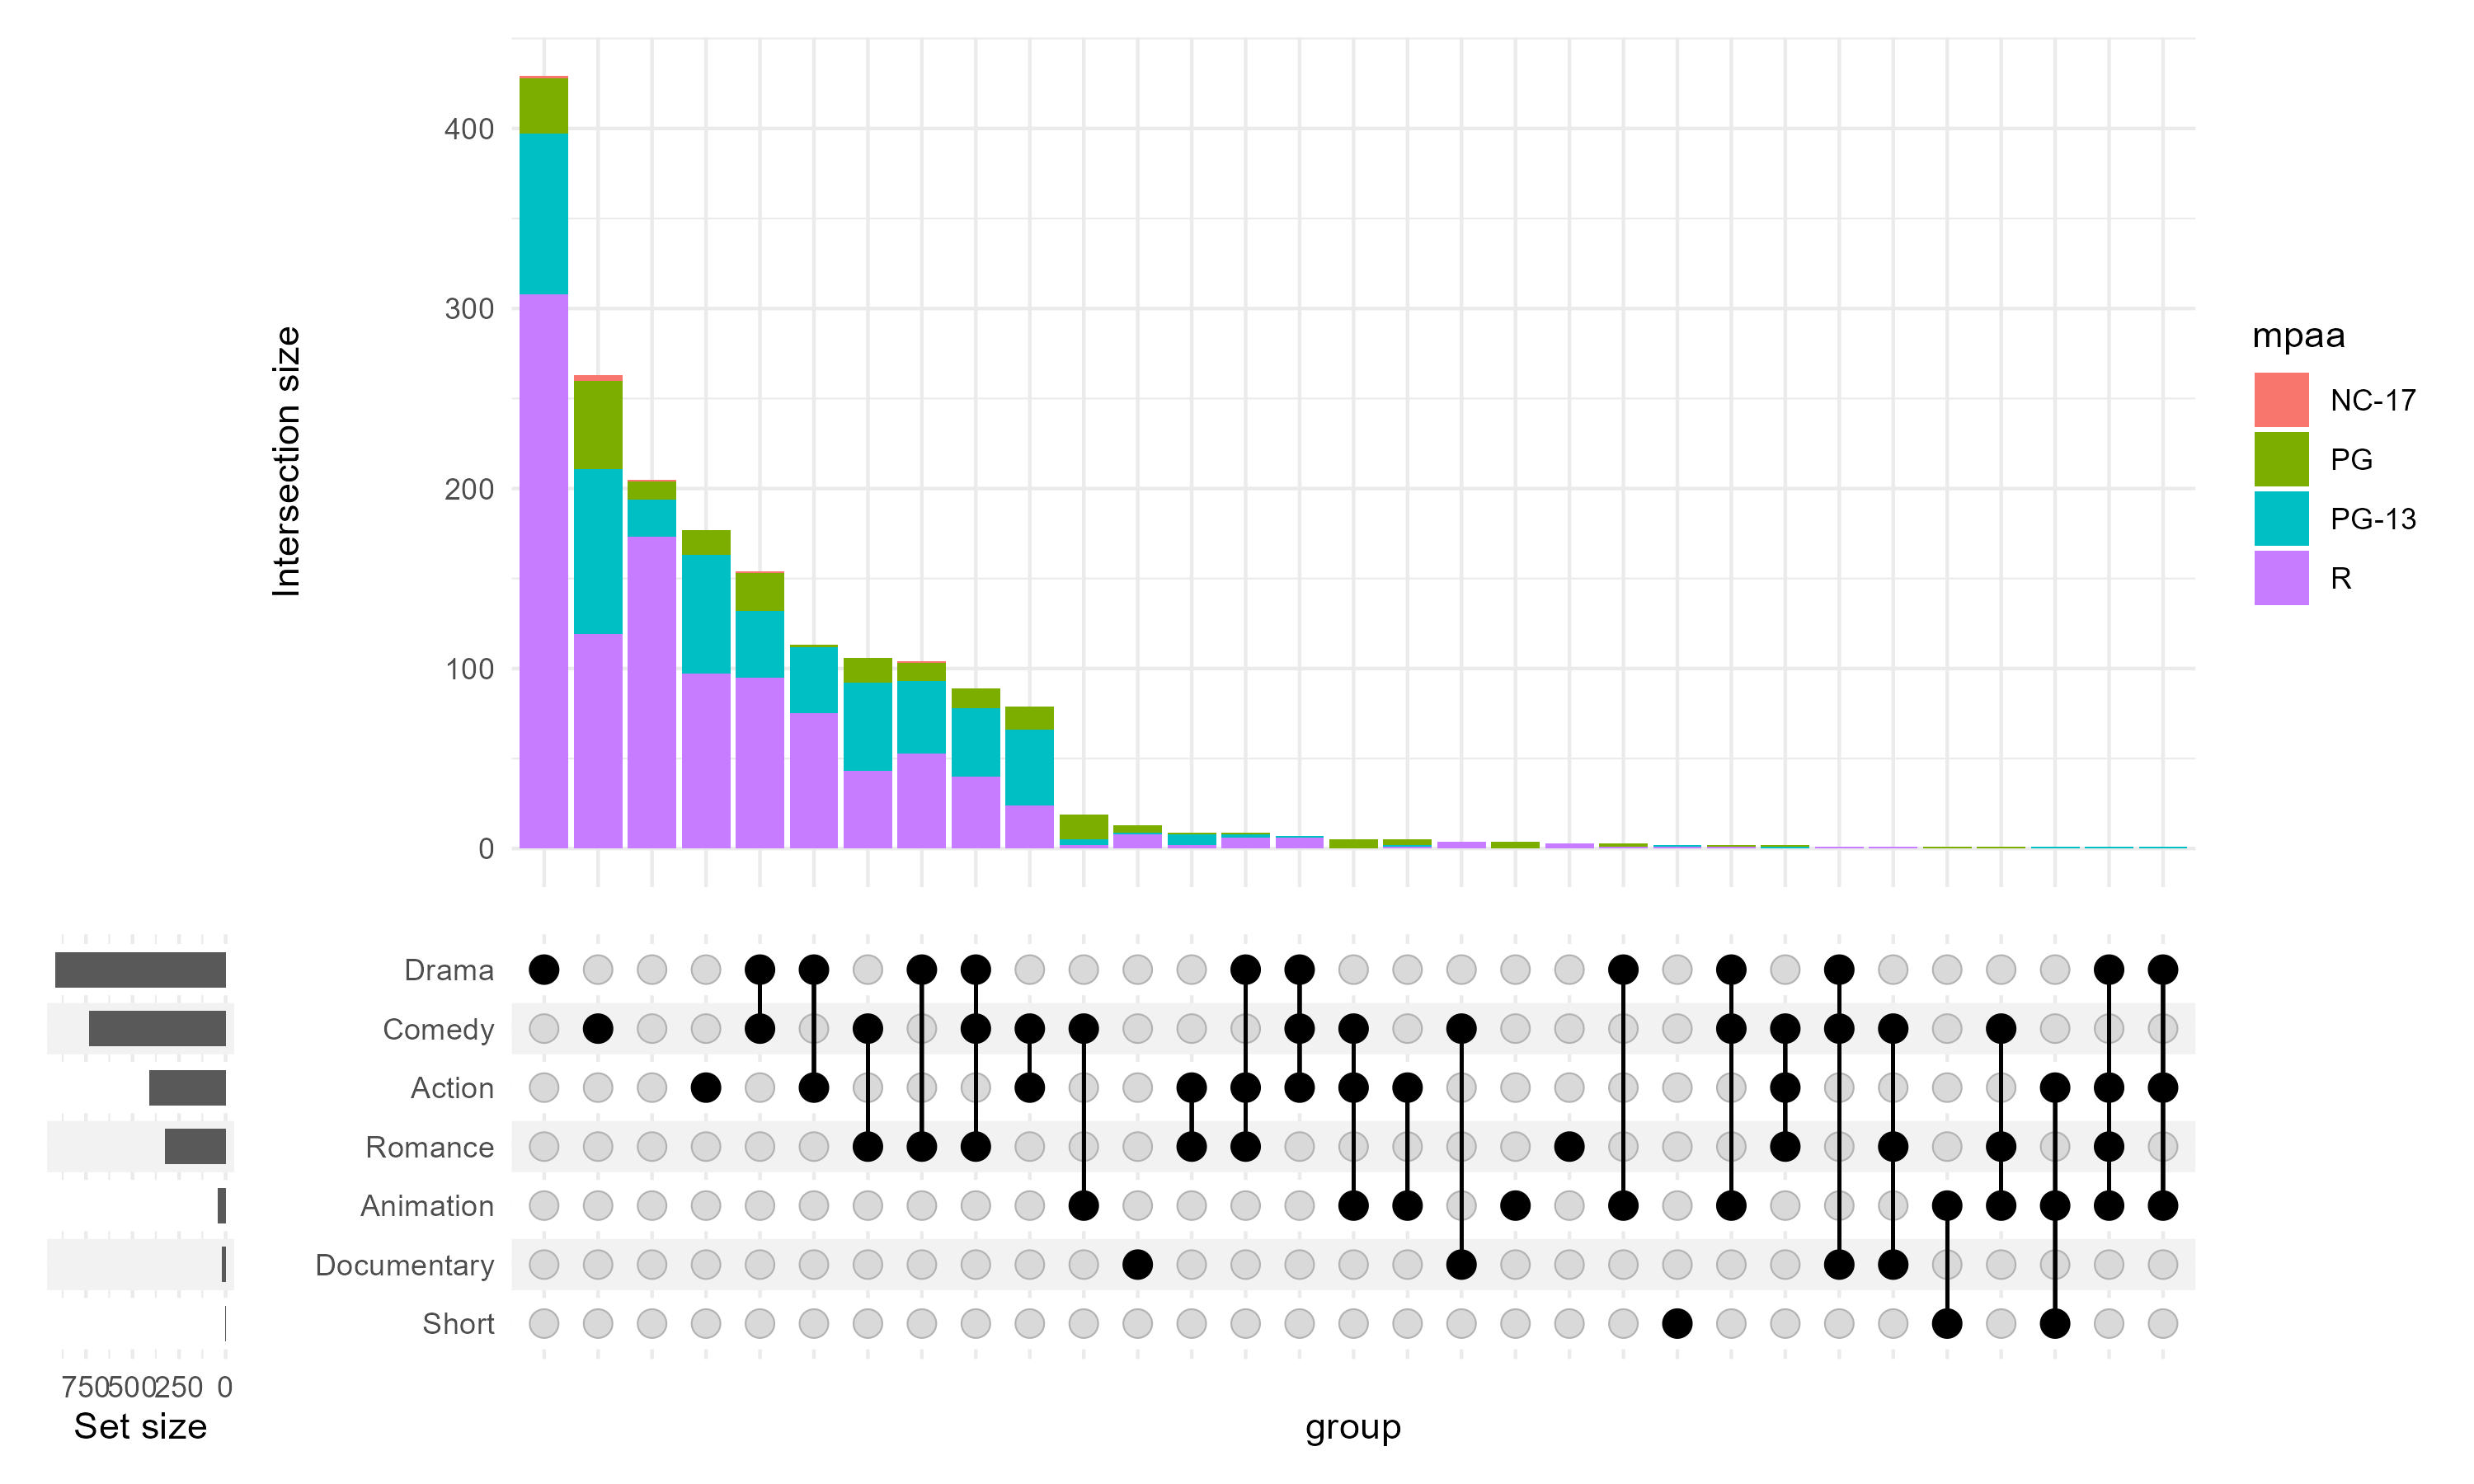
- 柱状图+Upset
set_size(8, 3)

upset(
  movies,
  genres,
  base_annotations=list(
    'Intersection size'=intersection_size(
      counts=FALSE,
      mapping=aes(fill=mpaa)
    )
  ),
  width_ratio=0.1
)
获得本教程 Data and Code,请在后台回复:20240815。
若我们的教程对你有所帮助,请 点赞+收藏+转发,这是对我们最大的支持。
往期部分文章
1. 最全WGCNA教程(替换数据即可出全部结果与图形)
2. 精美图形绘制教程
3. 转录组分析教程
4. 转录组下游分析
小杜的生信筆記 ,主要发表或收录生物信息学教程,以及基于R分析和可视化(包括数据分析,图形绘制等);分享感兴趣的文献和学习资料!!