R语言绘图 | 使用ggplot2绘制热图,指定显示基因和旋转
[](http://mp.weixin.qq.com/s?__biz=MzAwODY5NDU0MA==&mid=2455861689&idx=2&sn=bf497c5f96fbccc071751f5e9eb087a5&chksm=8cff27dabb88aecc14142b2712e8bbd0f4ed2d6660b4814cd2031212edf682bd8c61f2fb391a&scene=21#wechat_redirect)# # 原文链接:(https://mp.weixin.qq.com/s/Dh96b-O16_cS5JQ3wUqKeg)
# 绘图代码
**1.创建数据**
```R
set.seed(123)
genes <- c("TP53", "BRCA1", "EGFR", "VEGFA", "APOE", "IL6", "TNF", "INS", "ESR1", "MTHFR")
samples <- c(paste("CK",1:5, sep = ""),
paste("Treat",1:5, sep = ""))
data_matrix <- matrix(runif(100, min = -2,max = 2), nrow = 10,
dimnames = list(genes, samples))
```
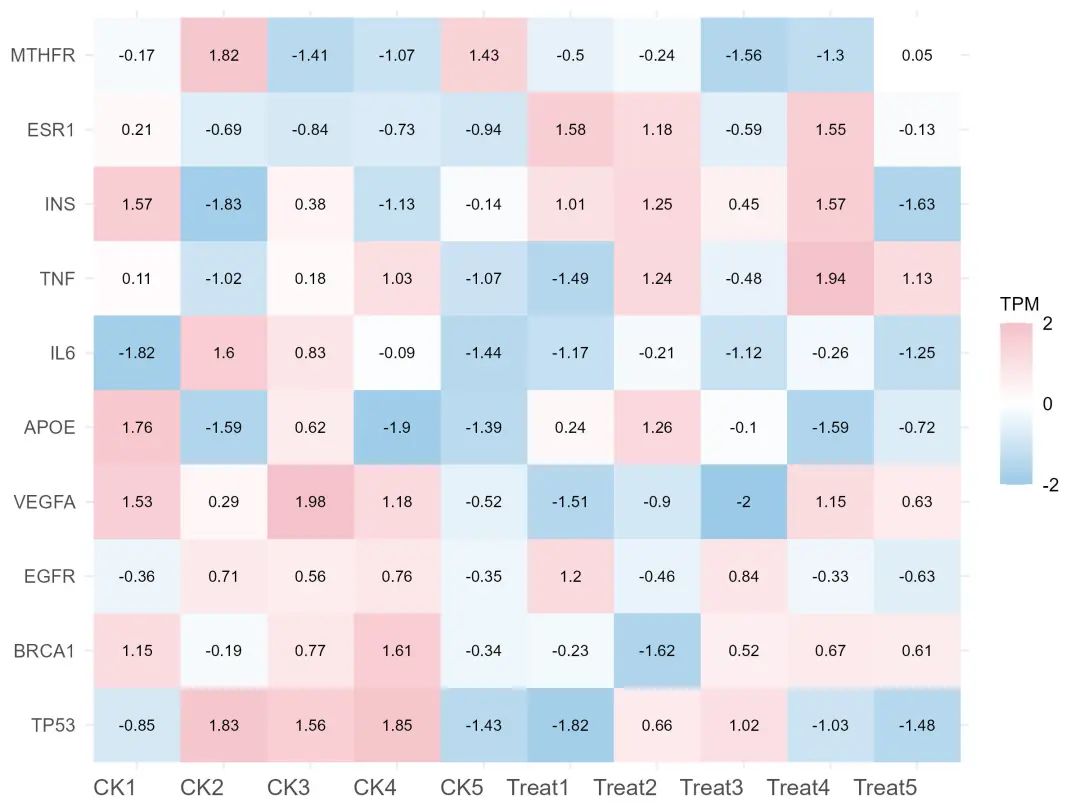
1. **转换数据**
**data\_df <- as.data.frame(as.table(data\_matrix))**
1. **绘制基础图形**
```plain
ggplot(data_df, aes(Var2, Var1, fill=Freq)) +
geom_tile() +
geom_text(aes(label=round(Freq,2)), color = "black",size = 3# 修改图中字体大小
)+
scale_fill_gradient2(low="#9ACAE8",mid = "white", high="#F5C1C8", midpoint = 0,
## 取值范围
limits = c(-2,2),
## 修改
name = "TPM",
# 自定义颜色条的刻度
breaks = c(-2,0,2),
) +
labs(x = NULL, y = NULL, title = NULL)+
theme_minimal()+
theme(
# plot.title = element_text(size = 16), # 修改标题的字体大小
# axis.title.x = element_text(size = 14), # 修改x轴标签的字体大小
# axis.title.y = element_text(size = 14), # 修改y轴标签的字体大小
axis.text.y = element_text(size = 10), # 修改y轴刻度标签的字体大小
legend.title = element_text(size = 10), # 修改图例标题的字体大小
legend.text = element_text(size = 10), # 修改图例文本的字体大小
axis.text.x = element_text(size = 12,angle = 0, hjust = 1)) # 旋转x轴标签,使其可读性更强
```
[!(/source/plugin/zhanmishu_markdown/template/editor/images/upload.svg) 附件:image.png](forum.php?mod=attachment&aid=290 "attachment")
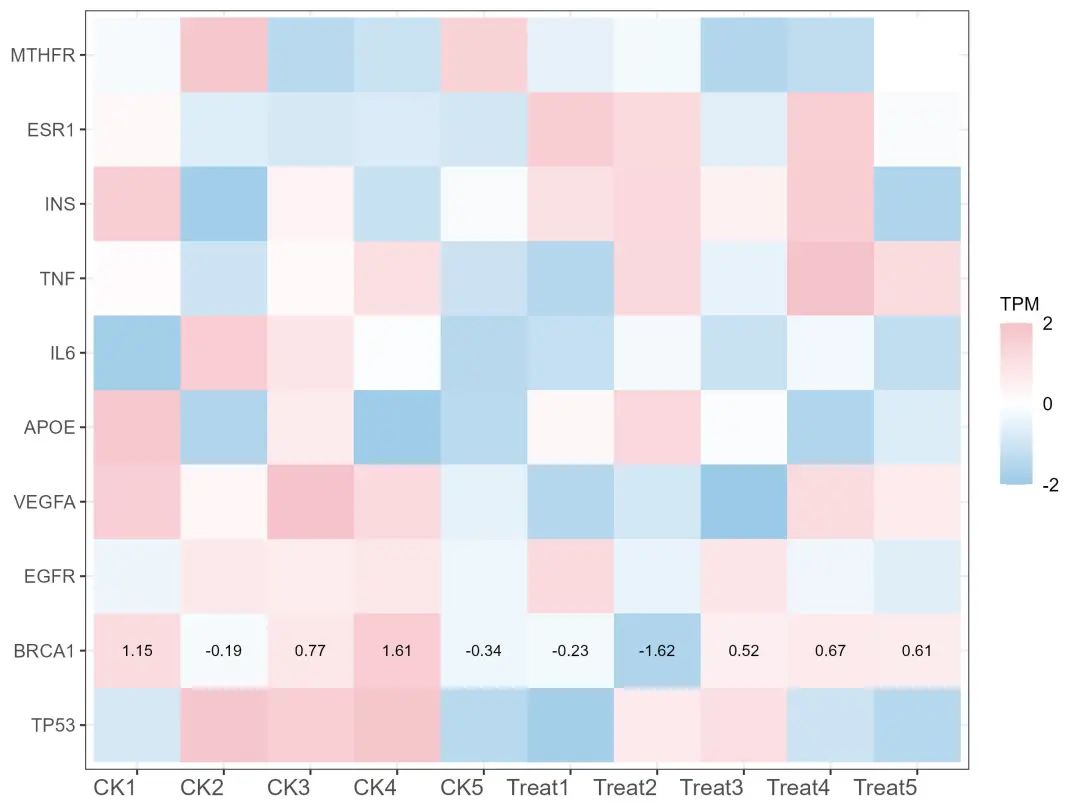
1. **只显示指定基因表达量**
```plain
ggplot(data_df, aes(Var2, Var1)) +
geom_tile(aes(fill = ifelse(Var1 == "BRCA1", Freq, Freq))) +# 使用Freq作为默认值
geom_text(aes(label = ifelse(Var1 == "BRCA1", round(Freq, 2), "")), color = "black", size = 3) +# 仅显示BRCA1基因的表达量
scale_fill_gradient2(low="#9ACAE8",mid = "white", high="#F5C1C8", midpoint = 0,
## 取值范围
limits = c(-2,2),
## 修改
name = "TPM",
# 自定义颜色条的刻度
breaks = c(-2,0,2),
) +
labs(x = NULL, y = NULL, title = NULL)+
#theme_minimal()+
theme_bw()+
theme(
# plot.title = element_text(size = 16), # 修改标题的字体大小
# axis.title.x = element_text(size = 14), # 修改x轴标签的字体大小
# axis.title.y = element_text(size = 14), # 修改y轴标签的字体大小
axis.text.y = element_text(size = 10), # 修改y轴刻度标签的字体大小
legend.title = element_text(size = 10), # 修改图例标题的字体大小
legend.text = element_text(size = 10), # 修改图例文本的字体大小
axis.text.x = element_text(size = 12,angle = 0, hjust = 1)) # 旋转x轴标签,使其可读性更强
```

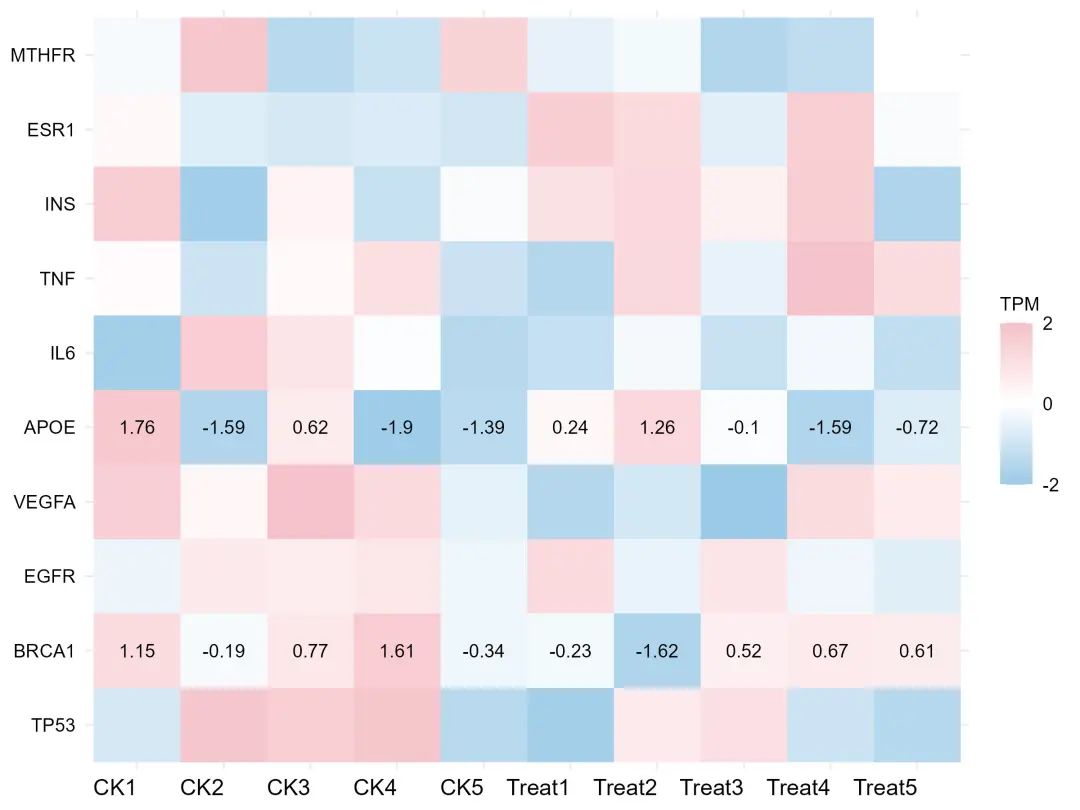
1. **显示多个基因**

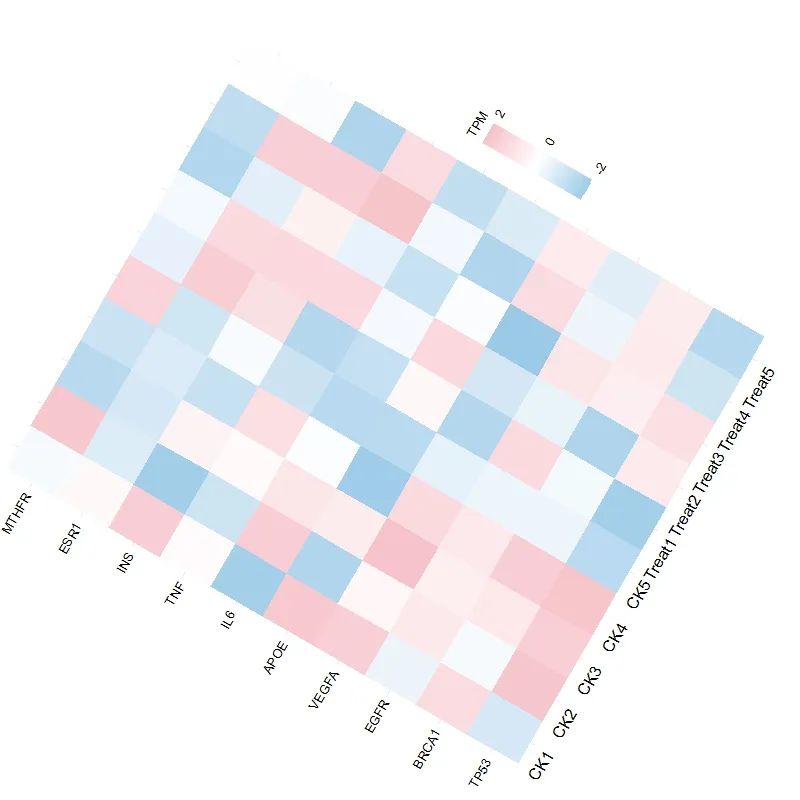
**6. 旋转图形**
```plain
p <- ggplot(data_df, aes(Var2, Var1, fill=Freq)) +
geom_tile() +
scale_fill_gradient2(low="#9ACAE8",mid = "white", high="#F5C1C8", midpoint = 0,
## 取值范围
limits = c(-2,2),
## 修改
name = "TPM",
# 自定义颜色条的刻度
breaks = c(-2,0,2),
) +
labs(x = NULL, y = NULL, title = NULL)+
theme_minimal()+
theme(
axis.text.y = element_text(size = 10, color = "black"),
legend.title = element_text(size = 10, color = "black"),
legend.text = element_text(size = 10, color = "black"),
axis.text.x = element_text(size = 12, color = "black",
angle = 0, hjust = 1))
# 将ggplot对象转换为grob对象
g <- ggplotGrob(p)
# 创建一个弯曲的视图端口
pushViewport(viewport(width=unit(0.8, "npc"), height=unit(0.8, "npc"), angle=60))
# 绘制弯曲的热图
grid.draw(g)
```

**获得本教程代码和数据,后台回复关键词:20240612**
**若我们的教程对你有所帮助,请**点赞+收藏+转发**,这是对我们最大的支持。
### 往期部分文章
**「1. 最全WGCNA教程(替换数据即可出全部结果与图形)」**
* (https://mp.weixin.qq.com/s?__biz=MzAwODY5NDU0MA==&mid=2455850466&idx=1&sn=6036fc2a19594f7fc38d65271f21e9cc&scene=21#wechat_redirect)
* (https://mp.weixin.qq.com/s?__biz=MzAwODY5NDU0MA==&mid=2455850727&idx=1&sn=1156c2bb0b0c9baff02838f5ffce39bf&scene=21#wechat_redirect)
* (https://mp.weixin.qq.com/s?__biz=MzAwODY5NDU0MA==&mid=2455850742&idx=1&sn=3d3eeedb3b58e536a83dc38d15725cd4&scene=21#wechat_redirect)
* (https://mp.weixin.qq.com/s?__biz=MzAwODY5NDU0MA==&mid=2455854728&idx=5&sn=bc98befb8dd0f0090bdfe69f3ffdb008&scene=21#wechat_redirect)
* (https://mp.weixin.qq.com/s?__biz=MzAwODY5NDU0MA==&mid=2455856103&idx=1&sn=774f8a084d21f757266f35c501c7155d&scene=21#wechat_redirect)
---
**「2. 精美图形绘制教程」**
* [精美图形绘制教程](https://mp.weixin.qq.com/mp/appmsgalbum?__biz=MzAwODY5NDU0MA==&action=getalbum&album_id=2614156000866385923&scene=173&from_msgid=2455848496&from_itemidx=1&count=3&nolastread=1#wechat_redirect)
**「3. 转录组分析教程」**
* **「**[转录组上游分析教程[零基础]](https://mp.weixin.qq.com/mp/appmsgalbum?__biz=MzAwODY5NDU0MA==&action=getalbum&album_id=2870608342451224581&scene=126&uin=&key=&devicetype=Windows+10+x64&version=63090719&lang=zh_CN&ascene=0)**」**
* **「**[一个转录组上游分析流程 | Hisat2-Stringtie](https://mp.weixin.qq.com/s?__biz=MzAwODY5NDU0MA==&mid=2455857417&idx=1&sn=653f3bdb0af386c22a128732ec8a01a4&scene=21#wechat_redirect)**」**
**「4. 转录组下游分析」**
* [批量做差异分析及图形绘制 | 基于DESeq2差异分析](https://mp.weixin.qq.com/s?__biz=MzAwODY5NDU0MA==&mid=2455860684&idx=1&sn=7be489c453cca737ad1092c6e4499827&scene=21#wechat_redirect)
* (https://mp.weixin.qq.com/s?__biz=MzAwODY5NDU0MA==&mid=2455859512&idx=1&sn=bac01a018f8b58afc7e2b3484f476bf4&scene=21#wechat_redirect)
* [单基因GSEA富集分析](https://mp.weixin.qq.com/s?__biz=MzAwODY5NDU0MA==&mid=2455859147&idx=1&sn=b022d80868e4b8014f64d443c82d1668&scene=21#wechat_redirect)
* [全基因集GSEA富集分析](https://mp.weixin.qq.com/s?__biz=MzAwODY5NDU0MA==&mid=2455860201&idx=1&sn=dd65c5b967123a876a6f5a38d4723ca6&scene=21#wechat_redirect)
**「小杜的生信筆記」** ,主要发表或收录生物信息学教程,以及基于R分析和可视化(包括数据分析,图形绘制等);分享感兴趣的文献和学习资料!!
页:
[1]